class

Scholars are busy attempting to predict the effects of climate change, including how it might harm people in some parts of the globe more than others.  A recent report by The Pacific Institute, sent in by Aneesa D., does a more fine-grained analysis, showing which Californians will be the most harmed by climate change.

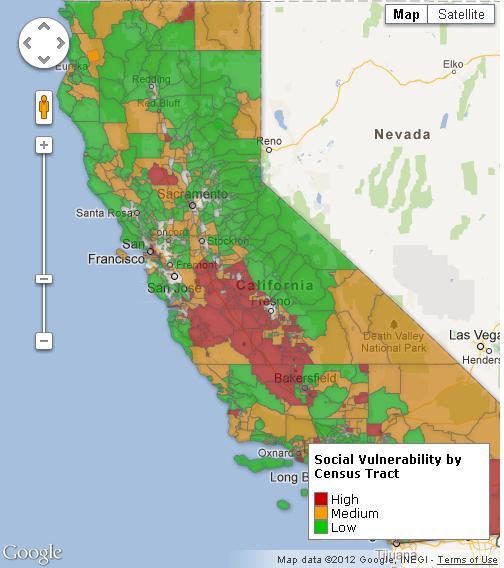
They use a variety of measures for each Census tract to make a Vulnerability Index, including natural factors (like tree cover), demographic factors (like age), and economic factors (like income).  At the interactive map, you can see the details for each Census tract.  Their compiled index looks like this:

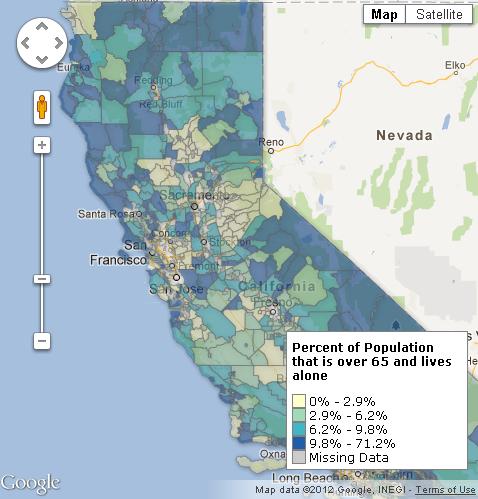
You can also see the Vulnerability Index for each measure individually.  Here is the data for the percent of people over age 65 who live alone, a variable we know increases the risk of death from heat wave.

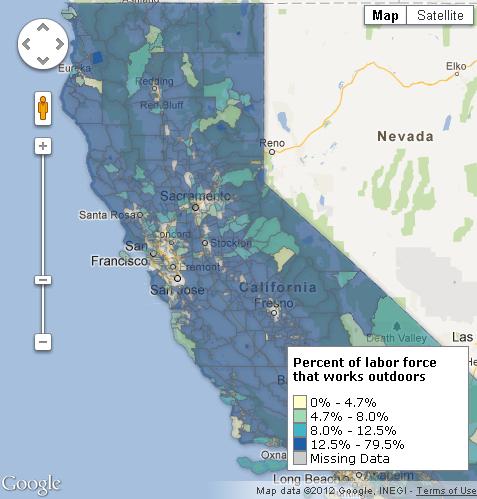
And here’s the data for the percent of workers who labor outside:

There’s lots more data at the site, but what’s interesting here is that, even in incredibly wealthy parts of the world, climate change is going to have uneven effects.  When it does, the most vulnerable people in the more vulnerable parts of the state are going to migrate to the other parts.  Most Californians don’t imagine that their cities will be home to refugees, but this is exactly what will happen as parts of California become increasingly difficult to live in.

Lisa Wade, PhD is an Associate Professor at Tulane University. She is the author of American Hookup, a book about college sexual culture; a textbook about gender; and a forthcoming introductory text: Terrible Magnificent Sociology. You can follow her on Twitter and Instagram.

Yesterday NPR discussed the results of a new study on charitable giving by the Chronicle of Philanthropy.  The study affirmed that lower income people give a larger percentage of their income to charity, but also discovered that how much wealthy people give is strongly correlated with the type of neighborhood they live in.

It turns out that wealthy people who live mostly with other wealthy people give the least amount of money to charity, on average.  Here are five zip codes with high-densities of rich people according to the IRS (= % of “wealthy filers”) and the percent of their incomes that they donated to charity (= “percent given”):

In contrast, here are five zip codes with a great deal of economic diversity.  In this case, the far right column shows a dramatic increase in the percent of their incomes that they donate to charity:

Wow, so rich people in Manhattan donate less than 1% of their income to charity, whereas the rich in Brooklyn give 35%.  That’s a pretty amazing divergence!

—————————

There are (at least) three explanations for this finding.   One is that living in a diverse neighborhood makes you more inclined to give, whatever your inclination before moving there.  Another is it that generous rich people move to diverse neighborhoods and stingy rich people isolate themselves.   A third is that some other variable (e.g., political affiliation, religiosity) is correlated with both neighborhood preference and generosity.

A social psychologist interviewed by, Paul Piff, suggests that it’s the first explanation.  Rich people tend to be isolated, he says, so they just don’t notice that other people need help. But, if they see need, they do show compassion.

I’m sure Piff knows his stuff, but if I had the opportunity to follow up with him on this argument, I’d ask him more about what he means by “see.”  It seems to me that anyone that reads the news these days will be exposed to plenty of evidence of economic need and, if you care enough to dig for it a little bit, you’ll find stunning data documenting income inequality and heart-rending stories of widespread suffering.  It may be easy to be isolated, but I imagine one would have to at least occasionally turn a blind eye to these things.

But perhaps knowledge about need isn’t sufficient; perhaps we only “see” need when we come into direct contact with human beings, the ones with who become familiar to us. There is evidence that we find it easy to blame strangers for their misfortune, but chock it up to bad luck when it’s us, our friends, or our families.  So perhaps raising consciousness about poverty isn’t enough, perhaps we really do need to get the rich to rub elbows with the disadvantaged.

In any case, the results are pretty impressive and no doubt have some wide-ranging implications for how to make us a more compassionate and generous society.

Lisa Wade, PhD is an Associate Professor at Tulane University. She is the author of American Hookup, a book about college sexual culture; a textbook about gender; and a forthcoming introductory text: Terrible Magnificent Sociology. You can follow her on Twitter and Instagram.

Cross-posted at Reports from the Economic Front.

It’s election season and Republicans and Democrats are working hard to demonstrate that they support dramatically different policies for rejuvenating the economy.

While the Democratic Party’s call for more government spending makes far more sense than the Republican Party’s call for cuts in government spending (see below), the resulting back and forth hides the far more serious reality that our existing economic system no longer appears capable of supporting meaningful social progress for the great majority of Americans.

The chart below helps to highlight our economy’s worsening stagnation tendencies.  Each point shows the 10 year annual average rate of growth and the chart reveals a decade long growth trend that is moving sharply downward.

As David Leonhardt explains:

The economy’s recent struggles arguably began in late 2001, when a relatively mild recession ended and a new expansion began. The problem with this new recovery was that it wasn’t especially strong. From the fourth quarter of 2001 through the fourth quarter of 2007 (when the financial crisis began), the economy grew at an average annual rate of only 2.7 percent. By comparison, the average annual growth rate of both the 1990s and 1980s expansions exceeded 3.5 percent.

This mediocre expansion was followed by the severe recession and weak recovery brought on by the financial crisis. The combined result is that, in recent years, the economy has posted its slowest 10-year average growth rates since the Commerce Department began keeping statistics in 1947.

In fact, the economic growth figures for the period 1995 to 2007 were artificially propped up by a series of bubbles, first stock and then housing.  Once those bubbles popped, average growth rates began steadily falling.

The weakness (and unbalanced nature) of our current weak recovery is well captured in the following chart from Catherine Rampell, which compares the percent change in various indicators in the current recovery (which began in June 2009) with previous post-war recoveries.  The first point to stress is that the current recovery lags the average in all indicators but one: corporate profits.  The second is that government spending has actually been falling during the current recovery, no doubt one reason that the percent increase in so many indictors remains below the average in previous recoveries; the public sector is actually smaller today than it was three years ago.

The relative strength in the performance of corporate profits helps to explain why the two established political parties feel no real pressure to focus on our long term economic problems; corporations just don’t find the current situation problematic despite the economy’s weak overall economic performance.

Even more telling of the growing class divide is the explosion in income inequality over the last thirty years, which is illustrated in the following chart.

In other words, while corporations have succeeded in raising profits at the expense of wages, those in the top income brackets have been even more successful in raising their income at the expense of almost everyone else.  Notice, for example, that median household income in 2010 is roughly where it was in the late 1980s while the median income of the top households racked up impressive gains. Thus, the very wealthy have every reason to do what they are currently doing, which is using their wealth to ensure that candidates restrict their economic proposals to reforms that will do little to change the existing system.

The takeaway: without a mass movement demanding change, election debates are unlikely to seriously address our steady national economic decline.

Cross-posted at Corporate Governance.

Sociologists Richard Zweigenhaft and G. William Domhoff began studying ascendance to the top corporate office 20 years ago and, while the population of CEOs is far from diverse, they report that they have been surprised to see as many women and minorities as they have.  Today there are 80 white women, African Americans, Latinos, and Asian Americans at the head of Fortune 500 companies.

In a discussion about their book, The New CEOs, at The Society Pages, they ask whether the rise of non-white/non-male CEOs is really a disruption in the distribution of power.  Despite protestations to the contrary — “all CEOs, it seems, worked their way up from the bottom,” they say with tongue in cheek — almost all come from wealthy backgrounds.  The rising diversity, in other words, doesn’t include class diversity.

With one exception: African Americans.  Most African American CEOs, they show, did not grow up in wealthy families.  “Many,” they write, “grew up with parents who were factory workers, postmen, custodians, day-care workers, or house cleaners.”  They refrain from speculating as to why they see this difference.

So, what’s next?  Zweigenhaft and Domhoff make some guesses as to the near future. The people positioned to be our next Fortune 500 CEOs will have graduated from college, got an MBA or law degree, will be currently earning more than $250,000 a year, and now hold a senior executive position.  Given these parameters, they conclude that:

…about two-thirds of those a step from the CEO office were white men, about 19% were white women, slightly fewer than 3% were African Americans, about 4% were Latinos, and about 8% were Asian Americans.

As the graph shows, compared to minority men, white women are far more likely to be rising into CEO positions in the near future.  Women of color, as they say, “almost disappear” in the data.  They explain that this likely has to do with their double minority status.  When hiring and promoting, people tend to look for ways of connecting with the potential employee.  A white man (usually doing the hiring) will see at least one thing in common with a white woman or a man of color.   As an example, they cite a study of executives with MBAs from Harvard:

…female Jewish executives all agreed that being female was more of an impediment to their careers than being a Jew, but many quickly emphasized that being Jewish, or different in any other way, was not irrelevant. As one put it, “It’s the whole package. I heard secondhand from someone as to how I would be perceived as a pushy, Jewish broad who went and got an MBA. Both elements, being Jewish and being a woman, together with having the MBA, were combined to create a stereotype I had to work against from the first day.” Another woman explained, “It’s part of the question of whether you fit the mold. Are you like me or not? If too much doesn’t fit, it impacts you negatively.”

These dynamics affect your entire career trajectory, of course, but Zweigenhaft and Domhoff believe they become even more intense as people approach the top office.  They conclude:

Culture (in the form of cultural capital), education, and class are all still in play. While gender and color remain the best predictors of who will make it into the upper echelons of the corporate world, beyond that, it’s intersectionality [of different identities together] wherever we look.

Lisa Wade, PhD is an Associate Professor at Tulane University. She is the author of American Hookup, a book about college sexual culture; a textbook about gender; and a forthcoming introductory text: Terrible Magnificent Sociology. You can follow her on Twitter and Instagram.

Tanita S. sent along a link to an interesting observation made over at Whatever.  John Scalzi, preparing to make lunch, noticed that he had two bags of an identical food product, except one was named “tortillas” and one was named “wraps.”

John did some sleuthing and discovered that the bag of wraps cost 26¢ more than the tortillas.  Moreover, since there were only 6 wraps in the package of wraps, but 8 tortillas in the package of tortillas, each wrap cost 19¢ more than each tortilla.

So, there is an interesting marketing story here.   Mission has figured out that they can sell their product for a higher price if they name it “wraps” (or, at least, they think they can). Let’s crowd source this.  After all, Mission is counting on our collective network of ideas (and a failure to notice the count difference) to push us towards the wraps instead of the tortillas.  What does “wraps” make you think of?  What else is that word linked to that might make a person prefer it?  Would you feel different bringing home a package of wraps?  In other words, what ideas, lying just beneath the surface, are they tapping into with this marketing strategy?

Lisa Wade, PhD is an Associate Professor at Tulane University. She is the author of American Hookup, a book about college sexual culture; a textbook about gender; and a forthcoming introductory text: Terrible Magnificent Sociology. You can follow her on Twitter and Instagram.

Often, the most socio-economically disadvantaged individuals of a group are used as a wide brush to paint a picture of an entire minority race or ethnicity.  Common examples include stereotyping all Black men as members of the inner-city underclass or as uneducated, unemployed, urban criminals, or all African-American women as “welfare queens.”  In the current cultural and political discourse, Hispanics are often prejudicially construed  as murderous drug-smugglers or as destitute immigrants who illegally cross the border to “drop babies” and exploit U.S. social programs.  As Eduardo Bonilla-Silva has argued, these prejudices then disadvantage minorities of all social classes who are stereotyped and experience discrimination regardless of their individual socio-economic status or accomplishments.

However, focusing on the marginal members during the social construction of an entire racial group does not usually occur with Whites.  The existence of poor Whites is often ignored as Caucasians are stereotyped as upper-class—which usually entails assumptions that they are hardworking, highly-moral, successful exemplars of American individualism, as Kirby Moss explains in The Color of Class.  “The Whitest People,” a skit from Carlos Mencia (a controversial comedian who built his career drawing upon his Hispanic background to explore race in America), illustrates the connections between whiteness and heightened class status (sorry about the ad):

Mencia’s construction of whiteness critiques the excesses and frivolousness of the upper-middle class lifestyle often conflated with whiteness.  While Mencia pokes fun at this lifestyle, outside comedy these same stereotypes mean Caucasians are usually viewed positively as many presume the upper class can only be reached through hard work and strong morals.  Whereas minorities are often presumed poor and thus viewed with suspicion, whites are often prejudged favorably.  For instance, Mencia himself mentions that because people are viewed through prejudicial lenses, when whites drink alcohol they are thought “sophisticated” but when Blacks drink they are accused of being “drunks.”  These differential prejudgments based on race are the basis of white privilege that replicates and reinforces both class, and racial stratification.

The open expression of Latino stereotypes and slurs in this video also highlights why Mencia’s comedy is controversial.  Detractors claim he engages in a process symbolic interactionists call trading power for patronage (see Schwalbe et al. 2000)This process occurs when an individual embodies a marginal identity in order to receive personal benefits that come at the expense of the larger group.  For example, while Mencia’s comedy career benefits from the self-deprecating humor in this video about low wage employment, family violence, and food insecurity his jokes might also reinforce negative stereotypes about Hispanics.

However, Carlos Mencia’s supporters describe the open confrontation of race and racial disadvantage in his comedy as contesting stigma (Goffman) by celebrating a minority group’s ability to persevere despite their marginalization.  To this group, Mencia’s frequent use of ethnic slurs to describe himself and other Latinos is an example of re-appropriation (Galinsky et al.), reclaiming a pejorative label in a way that redefines the meaning of racist slights and infuses the word with positive and empowering meanings.

—————

Jason Eastman is an Assistant Professor of Sociology at Coastal Carolina University who researches how culture and identity influence social inequalities.

When we talk about residential segregation, we’re generally focusing on race, and for good reason — many cities in the U.S. still have incredibly high rates of racial segregation. However, a recent Pew Research Center report looks at economic segregation, which is increasing in U.S. neighborhoods.

Economic segregation refers to the degree to which people in different social classes live mostly among other people of their class. In 2010, the majority (76%) of people in the U.S. lived in middle-class or mixed-income neighborhoods. But economic segregation has increased in the last few decades. More of both lower-income and upper-income households live in Census tracts made up of households primarily like themselves:

The RISI index for a city just combines the % of both groups that live in tracts dominated by their own income group (so the maximum score is 200). Looking at RISI scores by region, we see that the Southwest has the most economic segregation, and has increased more than any other region in the past 30 years:

The Pew report argues that this is related to the general increase in income inequality, with less than half of the U.S. population falling into the middle class by 2010, and the upper class (here defined as those making more than $104,000) increasing:

Economic segregation is still a less prominent feature of cities than racial segregation is. But given its steady increase, it’s worth thinking about the consequences of the relative isolation of different social classes from one another. When the rich, poor, and middle-income groups live in different parts of town, who will have the political influence to draw municipal spending to their neighborhoods? How will this growing residential pattern affect who has access to nice parks, public facilities such as libraries and recreation centers, and maintenance for schools and roads — or, alternatively, whose neighborhoods become the location for generally undesirable or unpleasant industries or land uses?

NPR’s Planet Money blog posted an interesting image of differences in how we allocate income based on how much we make. The image looks at three income groups and shows what percent of their  household income budget they spend various categories, using Bureau of Labor Statistics Consumer Expenditure Survey data:

As we see, the largest expense for every group is housing; for the low-income group, 40% of their income goes just to paying for a place to live. They also use more of their income to cover basic necessities — utilities, food eaten at home, transportation.The high-income group, on the other hand,  spends quite a bit more on education.

Look at that last row: saving for retirement (which includes Social Security contributions). This is a particularly striking difference. The affluent are able to put away a significant portion of their income for retirement; for those living just above the poverty line, it’s much, much less than the amount financial planners would recommend (even the middle-income group is saving about the minimum amount generally recommended to prepare for retirement). When so much of your income goes to simply meeting day-to-day needs, saving for the future is a luxury many just cannot afford.

UPDATE: NPR has updated their post, saying the image they had up initially incorrectly. They posted a new image, with notably lower spending on housing:

Eagle-eyed reader David C. pointed this out to me. The revised numbers seem surprisingly low to both of us.Looking at the NPR post again, I think I misunderstood what they were representing; I think this isn’t the percent of total income, but rather % of the household budget, which may not be identical. That said, I looked at some Consumer Expenditure Survey data (here and here) and can’t get the numbers to work out to what they’re showing in the updated image. If someone can, please send us a note at socimages(at)thesocietypages.org and we’ll do another update. Thanks!