product: alcohol

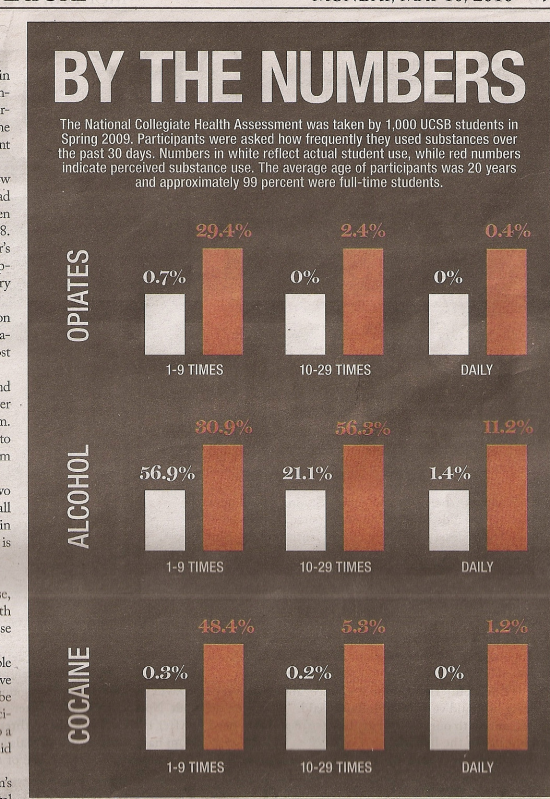
The phrase “pluralistic ignorance” refers to a situation where a large proportion of a population misunderstands reality.  They may all agree, but they are, nonetheless, mistaken.  This data on University of California-Santa Barbara students from the National Collegiate Health Assessment is a great illustration of this idea; it’s also a great illustration, however, of a terrible, terrible illustration.

Let’s get past the bad graphic first.  The white bars (which represent the percent of people reporting that they themselves used opiates, alcohol, or cocaine) are all the same height, despite the fact, for example, that 56.9% of students reported using alcohol 1-9 times in the last month, but only 0.3% reported using cocaine.  So the bars do not actually represent the percentages they are supposed to.  The red bars (which represent the percent of people that respondents think are using drugs and alcohol) suffer from the same problem.  In one case, the white bar should be even higher than the red bar.

But, if we can get past the poor graphic, then the information is really interesting.  In all but one case, the number of people reporting drug and alcohol use is smaller than the perceptions of how many people are using these substances.  For example, looking at the middle column, (almost) no one reports using opiates or cocaine 10-29 times last month, but students perceive  that 2.4% and 5.3% of the population (respectively) are; similarly, 21.1% of students report drinking alcohol 10-29 times last month, but they perceive that over half the population is drinking that frequently.

This pattern is consistently true in all cases except for the percentage of people who drank alcohol 1-9 times in the last month.  The majority of respondents who drink reported that they did so at that rate, but they perceive that others are drinking far more than they are.  The overall impact of the illustration, then, is correct.  On the whole, students perceive more drug and alcohol use than they report.

It’s possible that people are underreporting and their perceptions are more true than the self-reports.  If their self-reports are more true, however, than we have a case of pluralistic ignorance.  In this case, students agree that the rate of drug and alcohol use is higher than it actually is.  They may, then, feel pressure to drink and do drugs more frequently to fit in, even as doing so results in just the opposite.

Eager Eyes, via Flowing Data.

—————————

Lisa Wade is a professor of sociology at Occidental College. You can follow her on Twitter and Facebook.

One example of the pervasive sexualization of beer is the ubiquitous personification of “blond” ales as blond women.  Tom Megginson at Change Marketing made this observation and collected a number of examples of this particular example of the gendering and sexualizing of food:

See more at Megginson’s post.  See also our other posts on gender and beer here, here, and here.

—————————

Lisa Wade is a professor of sociology at Occidental College. You can follow her on Twitter and Facebook.
Snehata K. sent in two commercials for Miller Lite that reproduce ideas of masculinity while encouraging men to do something usually seen as feminine: care about calories. In the commercials we see that it’s ok to drink beer with fewer calories than the regular, as long as you do it in a manly way:

What’s a feminine way of drinking light beer? Prioritizing calorie content over the taste. If you’re a guy, you can care about health/diet and thus want a lower-calorie beer, but only if you show you still care about beer the way men are supposed to: you appreciate the taste and won’t sacrifice it for anything.

Guys who forget that are embarrassingly girly. And being feminized is clearly stigmatizing, worthy of ridicule. Even women are disgusted by feminized men. So not only will men who fail to adequately perform masculinity be ridiculed by men, they’ll lose any chance with hot chicks, too. As they do so often, men are receiving a clear message: be sure you’re masculine in every way, all the time, or you risk losing any claim you have to a respected version of manhood.

Of course, if you really want to be manly, you need to stop caring about silly things like your health altogether and drink Miller High Life.

PART ONE:

Drinking lowers your GPA. So do smoking, spending time on the computer, and probably other forms of moral dissolution. That’s the conclusion of a survey of 10,000 students in Minnesota.

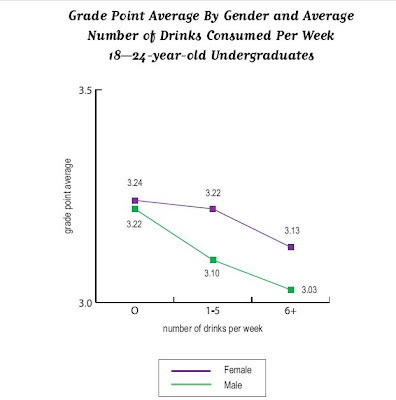
Inside Higher Ed reported it, as did the Minnesota press with titles like “Bad Habits = Bad Grades.” Chris Uggen reprints graphs of some of the “more dramatic results” (that’s the report’s phrase, not Chris’s). Here’s a graph of the effects of the demon rum.

Pretty impressive . . . if you don’t look too closely. But note: the range of the y-axis is from 3.0 to 3.5.

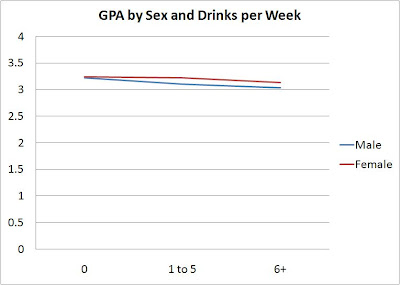
I’ve blogged before about “gee whiz” graphs , and I guess I’ll keep doing so as long as people keep using them. Here are the same numbers, but the graph below scales them on the traditional GPA scale of 0 to 4.0.

The difference is real – the teetotalers have a B+ average, heaviest drinkers a B. But is it dramatic?

I also would like finer distinctions in the independent variable, but maybe that’s because my glass of wine with dinner each night, six or seven a week, puts me in the top category with the big boozers. I suspect that the big differences are not between the one-drink-a-day students and the teetotalers but between the really heavy drinkers – the ones who have six drinks or more in a sitting, not in a week– and everyone else.

—————————-

PART TWO:

Some time ago, the comments on a post here brought up the topic of the “gee whiz graph.” Recently, thanks to a lead from Andrew Gelman, I’ve found another good example in a recent paper.

The authors, Leif Nelson and Joseph Simmons, have been looking at the influence of initials. Their ideas seem silly at first glance (batters whose names begin with K are more likely to strike out), like those other name studies that claim people named Dennis are more likely to become dentists while those named Lawrence or Laura are more likely to become lawyers

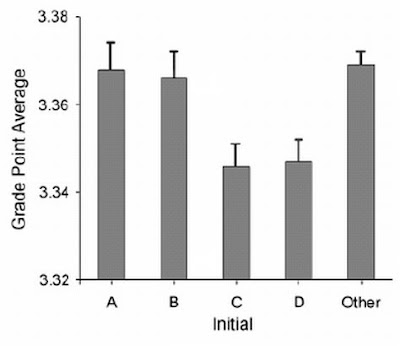
But Nelson and Simmons have the data. Here’s their graph showing that students whose last names begin with C and D get lower grades than do students whose names begin with A and B.

The graph shows an impressive difference, certainly one that warrants Nelson and Simmon’s explanation:

Despite the pervasive desire to achieve high grades, students with the initial C or D, presumably because of a fondness for these letters, were slightly less successful at achieving their conscious academic goals than were students with other initials.

Notice that “slightly.” To find out how slight, you have to take a second look at the numbers on the axis of that gee-whiz graph. The Nelson-Simmons paper doesn’t give the actual means, but from the graph it looks as though he A students’ mean is not quite 3.37. The D students average between 3.34 and 3.35, closer to the latter. But even if the means were, respectively, 3.37 and 3.34, that’s a difference of a whopping 0.03 GPA points.

When you put the numbers on a GPA axis that goes from 0 to 4.0, the differences look like this.

According to Nelson and Simmons, the AB / CD difference was significant (F = 4.55, p < .001). But as I remind students, in the language of statistics, a significant difference is not the same as a meaningful difference.

These aren’t really boobs, but they still may not be safe for work. So, after the jump…

more...

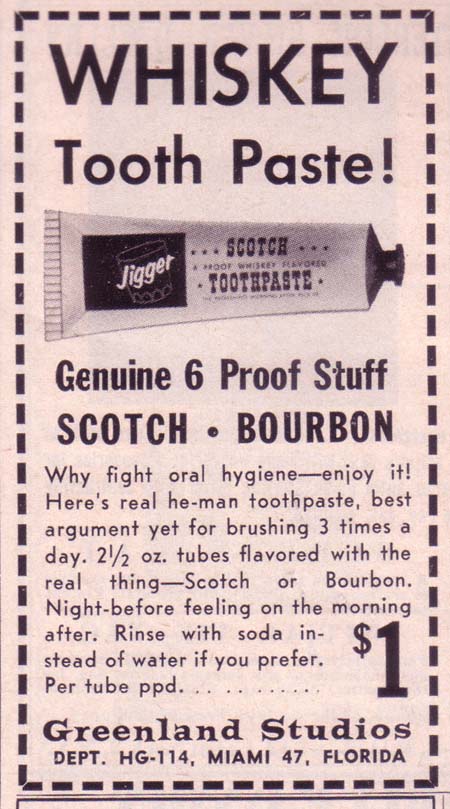
House and Garden magazine, 1961 (Copyranter):

jigger

What? Do you have a more hilarious and awesome example of social construction?  (I mean, other than tuna in jello?)  I want to see it.

Lisa Wade, PhD is an Associate Professor at Tulane University. She is the author of American Hookup, a book about college sexual culture; a textbook about gender; and a forthcoming introductory text: Terrible Magnificent Sociology. You can follow her on Twitter and Instagram.

We often talk about gender objectification on this blog, but we also try to talk about other types of objectification.  In this case, Literanista sent us a great example of racial/nationalist objectification.  The example comes from a tourism website for travelers to the Dominican Republic.  It offers, in one of its excursions, the chance to swim in a jungle river, enjoy a secluded beach, visit a “Rum Shack,” taste fresh sugarcane, see native animals and meet an honest-to-goodness-real-Dominican family.

Elsewhere, just to add some negative stereotyping, the website suggests that Dominican’s are drunk all the time:
In a similar vein, Karole F. sent in a photograph of some “African” carvings for sale a Stones ‘n Stuff in Exeter, New Hampshire.  Human beings are included as objectified tokens alongside animals:


For more tourism-related objectification, see our posts on tourism in Hawaii, Brazil, and Thailand, and, related, these images of international adoption and onesies for internationally adopted babies.

Lisa Wade, PhD is an Associate Professor at Tulane University. She is the author of American Hookup, a book about college sexual culture; a textbook about gender; and a forthcoming introductory text: Terrible Magnificent Sociology. You can follow her on Twitter and Instagram.

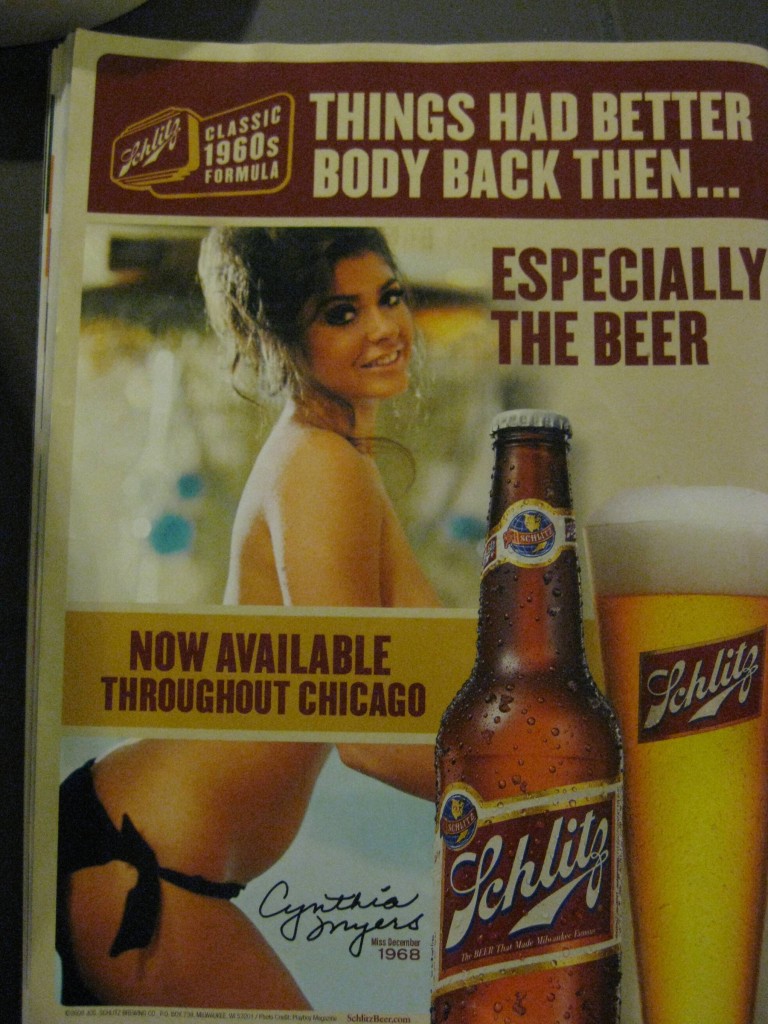
The ad below, sent in by Corinne C., expresses nostalgia for “classic” beers and classic women:
Picture1

(From TimeOut Chicago.)

Lisa Wade, PhD is an Associate Professor at Tulane University. She is the author of American Hookup, a book about college sexual culture; a textbook about gender; and a forthcoming introductory text: Terrible Magnificent Sociology. You can follow her on Twitter and Instagram.