Search results for The

Cross-posted at Organizations, Occupations and Work.

Last week the Wall Street Journal printed an article describing how CEOs around the world spend their time.  The article drew on data from a larger study, the Executive Time Use Project , and relied on reports of time use by CEO’s personal assistants.  The article indicates that assistants only tracked activities that lasted over 10 minutes in a single week selected by researchers.  That assistants, rather than the CEOs themselves, were keeping track of time use leads me to believe the reports are relatively accurate.  After all, the assistant probably does most of the scheduling of a CEOs day and CEOs are likely too busy to track data time or to agree to record their time use.

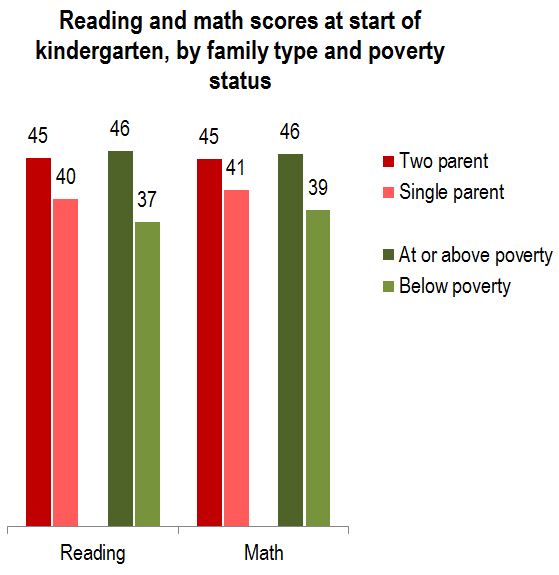
Here’s the break-down of the typical 55-hour work week for CEOs:

The hype about the findings is about the finding regarding time spent in meetings — 18 hours per week (see “Where’s the Boss? Trapped in a Meeting”).  I’m more interested in the task that occupies the greatest amount of a CEO’s time in a typical week—the 20 hours of “miscellaneous” activities.  The fine print indicates that the “miscellaneous” activities include time spent travelling, in personal activity including exercise or lunch with a spouse, or in short activities like quick, unscheduled phone calls.

The project website advertises that knowing how CEOs spend their time can tell a lot about management style and differences in cultures and performances.  Maybe it can, and here arearticles that tackle these issues.  I think it tells us something slightly different and far more basic than this: what constitutes “work” depends on who does it.  Would a study of low wage workers calculate as part of the work week “exercise”?  Do we count travel time to and from a job as “work” among mid-level managers?  The BLS American Time Use Surveys (Table 5, see footnote 2) do not include travel related to work in measures of work time. Why did the authors include as part of a CEO workday things like personal time and activities unrelated to work?

Without this personal time, a CEO’s average work week—35 hours—looks closer or shorter than other workers.   For example, among employed people who worked on an average weekday in 2010, the average weekly hours spent working at all jobs (excluding travel related to work), for workers with a H.S. diploma was 40.05 hours, for women who worked full-time, the average was 40.80 hours, for all full-time workers, the average weekly work hours was 41.95 hours (to calculate these weekly averages from the BLS, I assumed people worked 5 days a week which is typical for full-time workers, but may overestimate the work hours of those with a H.S. diploma).

Perhaps it is time to re-evaluate how we measure “work” or at least pay close attention to the ways we do so differently for workers at different levels of the hierarchy.  Now I’m headed to the gym for some exercise.  Should I all that “work”?  I’ll leave it to you to decide.

—————————

Julie Kmec is an associate professor of sociology at Washington State University.  She has conducted research on organizations and work, in particular on issues of gender and race inequality at work, the glass ceiling, employment discrimination, and sex segregation.  She is part of a working group at the Clayman Institute for Gender Research at Stanford University investigating ways to redefine work.

In a wonderful example of the social construction of time, there was no Friday, December 30th, 2011 in Samoa (NPR).

The country decided to move from one side of the International Dateline to the other.  The move, accomplished by skipping forward 24 hours, will allow it to align its week with its largest trading partners: Australia, New Zealand, China and Tonga.  Many business leaders were thrilled at the switch.

Thanks to sociologist Dan Hirschman for the tip!  Also in the social construction of time: Social Construction, Deviance, and Daylight Savings.

Lisa Wade, PhD is an Associate Professor at Tulane University. She is the author of American Hookup, a book about college sexual culture; a textbook about gender; and a forthcoming introductory text: Terrible Magnificent Sociology. You can follow her on Twitter and Instagram.

I recently had the pleasure of reading Peter Stearns’ Fat History: Bodies and Beauty in the Modern West.  The book chronicles the shift in American history from a plump to a thin ideal.  The beauty of Stearns’ book is his resistance to reducing the shift in norms to a simple cause. Instead, he traces the changes to conflicts between capitalism and religion, the backlash against women’s equality, industrialization and the devaluation of maternal roles, fashion trends, the professionalization of medicine, our cultural relationship to food, and more.

Stearns is quite specific in timing the change, however, pointing to the years between 1890 and 1910.  In these 20 years, he writes:

…middle-class America began its ongoing battle aginst body fat.  Never previously an item of systemic public concern, dieting or guilt about not dieting became an increasing staple of private life, along with a surprisingly strong current of disgust directed against people labeled obese.

I thought of Stearns’ book when I came across a delightful collection of photographs of exotic dancers taken in 1890, the year he pinpoints as the beginning of the shift to thinness.  From a contemporary perspective, they would likely be judged as “too fat,” but their plumpness was exactly what made these dancers so desirable at the time.

More at Retronaut.

Lisa Wade, PhD is an Associate Professor at Tulane University. She is the author of American Hookup, a book about college sexual culture; a textbook about gender; and a forthcoming introductory text: Terrible Magnificent Sociology. You can follow her on Twitter and Instagram.

Last week I posted about the stereotype that Black people love watermelons, explaining that it originated with efforts to justify slavery.  Black people were simple, slavery proponents argued, so a delicious watermelon was enough to make them happy.

This stereotype, long past its strategic usefulness, nonetheless persists.  Barack Obama’s election to the U.S. presidency, for example, inspired a rash of watermelon-themed commentary, including this one:

(source)

In light of this history, as well as the ongoing racism, the product below — a Valentine’s Day candy that pairs two Disney princesses — is rather, let’s say, insensitive.  The White Cinderella Aurora character decorates the vanilla flavored side; the Black Tiana character decorates the watermelon flavored side.  Just… wow.

Thanks to Caroline H. for forwarding this along.

Lisa Wade, PhD is an Associate Professor at Tulane University. She is the author of American Hookup, a book about college sexual culture; a textbook about gender; and a forthcoming introductory text: Terrible Magnificent Sociology. You can follow her on Twitter and Instagram.

Cross-posted at Thick Culture.

As of the 2010 Census, Latinos represent 17 percent of the US population, but are woefully underrepresented in traditional forms of political participation like voting and making campaign contributions. The Pew Hispanic center reports that while Latinos represented 21% of all eleigible voters in 2010, they accounted for only 6.6% of midterm election voters.

One area where Latinos are more likely to participate when compared to non-Latino whites is in outsider forms of participation like protest activity. This form of activity became synonymous with Latino political participation during the 2006 Grand Marcha where 500,000 protesters packed streets to protest immigration bills. A 2006 CIRCLE study finds that Latino youth, while not engaged in formal types of participation were much more likely to report having engaged in a protest:

Although young Latinos are generally not as engaged as other racial/ethnic
groups, 25% said that they had participated in a protest—more than twice the
proportion of any other racial/ethnic group.

By comparison, only 11% of all youth surveyed had reported taking part in a protest. The accounts for why Latinos protest more than other groups vary but a main causal fator is the lack of access to formal political channels, particularly for non-citizens and undocumented immigrants. Lisa Martinez (2008) points out that Latinos are less likely to engage in protest activity when they live in places with high numbers of elected officials. Is the increase in Latino political engagement via protest simply the result of demographic realities (e.g. residents can’t vote) or is it a leading indicator of an overall dissatisfaction with politics?

——————————

Jose Marichal, PhD, is an assistant professor of political science at California Lutheran University. He teaches and writes about: public policy, race and politics, civic engagement, the Internet and politics, and community development.  He is founder of the blog ThickCulture.

At The Color Line, sociologist C.N. Le highlighted an instance in which racist language was used in reference to pro-basketball player Jeremy Lin.  A headline at ESPN read, “Chink in the Armor.”  “Chink” is a term used to denigrate the Chinese and Asians more generally.

Le observes astutely that the word likely wasn’t meant as a slur, but instead a pun.  And, in fact, ESPN “quickly and decisively” took action, changing the headline, firing the person who wrote the headline, and suspending a sportscaster who repeated the phrase.

Instead of outright racism, Le suggests that the appearance of the word is symptomatic of a (false) belief that we’re in a colorblind post-power society.  In this society, every group is on equal footing, so making fun is just equal opportunity offensiveness; it may be off-color, but it’s all in good fun (think of South Park as an example).  The approach assumes that slurs like “chink” are no more harmful than slurs like “cracker.”

Le was disappointed to see that this kind of ongoing insensitivity to real power differences remains, but pleased to see ESPN react so swiftly and strongly to it.

—————————

Lisa Wade is a professor of sociology at Occidental College. You can follow her on Twitter and Facebook.

It’s a Leap Year for those using the Gregorian calendar, noteworthy because we get an extra day in February to correct the slight difference between our calendar year (365 days) and the actual amount of time it takes the Earth to revolve around the sun once (365 days, 5 hours, 48 minutes, and 46 seconds). Over the last few days I’ve heard several news stories about the Leap Day tradition of gender norms being inverted, so that women are able to ask out or propose to men. I was either entirely unaware of this or perhaps I learn it and promptly forget it every four years, but Laura E. sent in a link to a set of vintage postcards posted at Slate that illustrate the existence of this idea in the early 1900s. The postcards present this upending of the accepted gender script as a terrifying situation for men, who become prey to suddenly emboldened husband-hunters:


Text:

“John! I have some thing to ask you. Don’t be in a hurry.”

“Ah, say Mabel, please let me go home?”

The dog: “Poor John. I see his finish.”

In a recently-published article on this tradition, Katherine Parkin points out that women in such postcards are often presented as larger, brawnier, and more aggressive than their poor male prey; the women empowered to ask men to marry them are inherently unfeminine:

For more on portrayals of gendered dating/proposal norms and the Leap Year exception, see the full Slate slideshow and Parkin’s article. Now excuse me, I’m going to go see about ambushing myself a husband.

[Full cite: Katherine Parkin. 2012. “Glittering Mockery: Twentieth-Century Leap Year Marriage Proposals.” Journal of Family History 37(1): 85-104.

Cross-posted at Family Inequality.

In 1994, Sara McLanahan and Gary Sandefur published, Growing Up With A Single Parent: What Hurts, What Helps. The growth of children living with only their mothers was — then as now — a matter of concern not only for children’s well-being, but for intergenerational mobility. One of their empirical conclusions was this:

For children living with a single parent and no stepparent, income is the single most important factor in accounting for their lower well-being as compared with children living with both parents. It accounts for as much as half of their disadvantage. Low parental involvement, supervision, and aspirations and greater residential mobility account for the rest.

The biggest problem, in other words, is economic. The other factors —  involvement, supervision, aspirations, mobility — are related to social class and the time poverty that economically-poor parents experience.

Examples

Here are some bivariate illustrations — that is, head-to-head comparisons of the difference between children of poor and non-poor versus single and married parents.

These are the “skill group” rankings by teachers of children by socioeconomic status (or SES, a composite of parents’ education, occupational prestige and income) versus race/ethnicity, gender and family structure. SES shows the widest spread in reading teachers’ group placement of first graders.

Source: Condron (2007)

Similarly, the poor/nonpoor difference is greater than the two-parent/single-parent difference in kindergarten entry scores:

Source: Early Childhood Longitudinal Study (2009)

Those are just two examples from early-childhood assessments. More importantly, here is the breakdown seen in a longitudinal study of children growing up. When women grow up to be mothers, their poverty level in childhood is more important than their family structure for predicting whether they will be in poverty themselves. The poverty difference is large, the family structure difference is not:

Source: Musik & Mare (2006)

This study included a more sophisticated set of multivariate analyses than this simple graph, but the author’s conclusion fits it:

Net of the correlation between poverty and family structure within a generation, the intergenerational transmission of poverty is significantly stronger than the intergenerational transmission of family structure, and neither childhood poverty nor family structure affects the other in adulthood.

That is, childhood poverty matters more.

Fewer single parents, or less poverty?

But if single parenthood and poverty are so closely related, some people say, we should spend hundreds of millions of dollars promoting marriage to help children avoid poverty (and other problems). That’s what the government has done, with money from the welfare budget. Even if it worked, which it apparently doesn’t, it’s only one approach. What about reducing poverty? And, more specifically, reducing the relative likelihood of poverty in single-parent families versus those with married parents. That is, address the poverty gap between the two groups, rather than the size of the two groups. This has the added advantage of not singling out one group — single mothers — for social stigmatization (of the kind I mentioned here). And, because it defines the problem as economic rather than moral, may make it easier to build public support for helping the poor.

Consider a recent paper by David Brady and Rebekah Burroway, which will be published in Demography. They analyzed the relative poverty of single mothers versus the total population — that is, what percentage had incomes below half the median (per person, after accounting for taxes and government transfers). Such a relative poverty measure is really a measure of inequality, but specifically inequality at the low end. (Regardless of how rich the rich are, it’s theoretically possible to have no one below half the median income). Here is my graph showing that result, with only the countries that have reliable sample sizes in the survey:

The Nordic countries have the lowest overall poverty rates. But in absolute terms their advantage is much bigger for single mothers. (The red line shows equal poverty rates for single mothers and the total population.) The US and UK have the largest difference in poverty rates between single mothers and overall poverty. That is, we have the largest poverty penalty for single motherhood. If the relative poverty rates for single mothers were lower in the US, we might spend more time and money addressing poverty and less trying to change family structures.