While some austerity advocates really fear (although incorrectly) the consequences of deficit spending, the strongest proponents are actually only concerned with slashing government programs or the use of public employees to provide them.  In other words their aim is to weaken public programs and/or convert them into opportunities for private profit. One measure of their success has been the steady decline in public employment.  Floyd Norris, writing in the New York Times notes:

For jobs, the past four years have been a wash.

The December jobs figures out today indicate that there were 725,000 more jobs in the private sector than at the end of 2008 — and 697,000 fewer government jobs. That works into a private-sector gain of 0.6 percent, and a government sector decline of 3.1 percent.

In total, the number of people with jobs is up by 28,000, or 0.02 percent.

How does that compare? It is by far the largest four-year decline in government employment since the 1944-48 term. That decline was caused by the end of World War II; this one was caused largely by budget limitations.

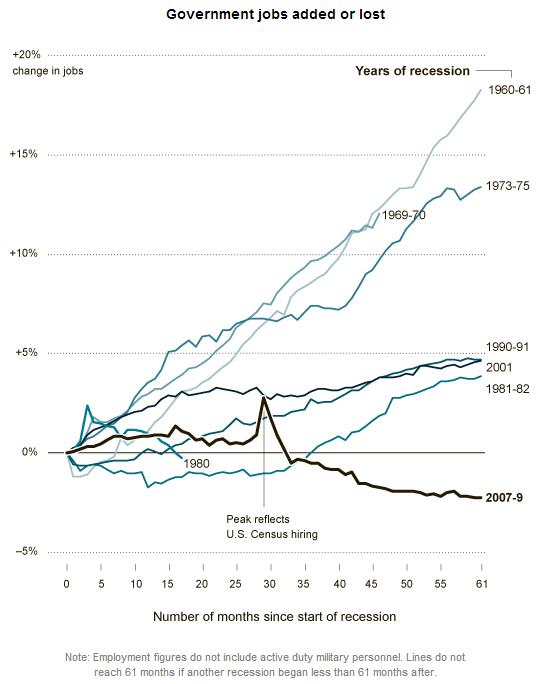
The chart below, taken from the same post, also reveals just how weak private sector job creation has been over the past 12 years (compare the top three rows — the presidencies of Obama and Bush — w job changes This graphic from the New York Times highlights just how significant the decline in public employment has been in this business cycle compared with past ones.  Each line shows the percentage change in public sector employment for specified months after the start of a recession.  Our recent recession began December 2007 and ended June 2009.   As you can see, what is happening now is far from usual.
1

It is also worth noting that despite claims that most Americans want to see cuts in major federal government programs, the survey data show the opposite.  For example, see the following graphic from Catherine Rampell’s blog post. economix-22pewwhattocut-blog480 As Rampell explains:

In every category except for “aid to world’s needy,” more than half of the respondents wanted either to keep spending levels the same or to increase them. In the “aid to world’s needy” category, less than half wanted to cut spending.

Not surprisingly, this assault on government spending and employment will have real consequences for the economy and job creation. All of this takes us back to the starting point — we are talking policy here.  Whose interests are served by these trends?

Martin Hart-Landsberg is a professor of economics at Lewis and Clark College. You can follow him at Reports from the Economic Front.
When I approached my undergraduate mentors about graduate school in 1996, they warned me that many people who earn PhDs never get jobs in academia.  This is sometimes deliberate, as their are jobs outside of academia for some degree-holders to get, but it’s also sometimes a grave disappointment.  My mentors emphasized the extent of the risk (and frankly scared me quite a lot), but how bad was it?  And is it worse today?

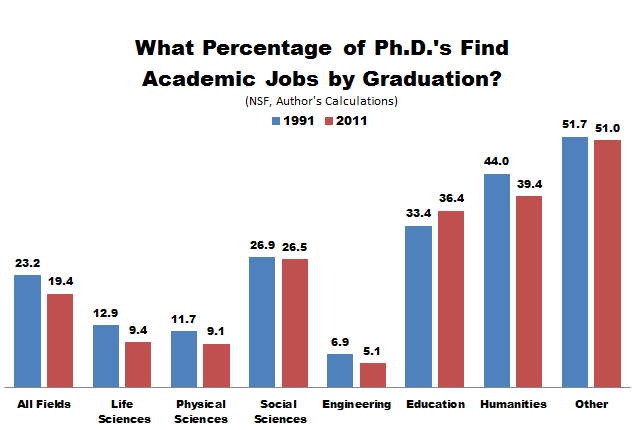
The Atlantic‘s Jordan Weissmann put together the data.  The leftmost bars on his figure show that, on average, under a quarter of PhDs landed a full-time job at a college or university in 1991.  That number had dropped to less than 20% by 2011.  The numbers, however, vary significantly by field:

1

See here for more details.

The looming question, of course, is what percentage of PhDs want a full-time academic job, something that certainly varies by field.  In other words, there aren’t a boatload of bitter engineers bad-mouthing the academy while slinging lattes at Starbucks.  Here’s a hint at an answer: A study published in 1999 found that 53% of all new PhDs said they wanted to become professors.  Ten years later, just over half were tenured (54%) and a handful more were tenure-track (7%); a third weren’t in academia at all.

On the one hand, I think these numbers are really depressing. Five to ten years is a long time to train for a career only to discover that, for whatever reason, you won’t be employed in the area of your expertise.  But I have two “on the other hands.”

On one other hand, I wonder how these numbers compare to other occupations?  We accept that certain occupations are highly competitive and include a lot of dumb luck and failure.  Modeling and acting are obvious examples, there are certainly others.  I know someone who’s spent their lifetime trying to become an astronaut.  Where does academia fall in the spectrum of risky job endeavors?

On a second other hand, I’d love to see some research on what happens to academics — especially in the humanities and social sciences — when they don’t get a job in academia or are denied tenure after getting there.  Within academia, this is often framed as THE END OF YOUR LIFE.  But maybe it’s often okay or pretty good.  Honestly, I don’t know.

Interesting and useful data, to be sure, but far from the whole story.

Lisa Wade, PhD is an Associate Professor at Tulane University. She is the author of American Hookup, a book about college sexual culture; a textbook about gender; and a forthcoming introductory text: Terrible Magnificent Sociology. You can follow her on Twitter and Instagram.

Cross-posted at Montclair SocioBlog.

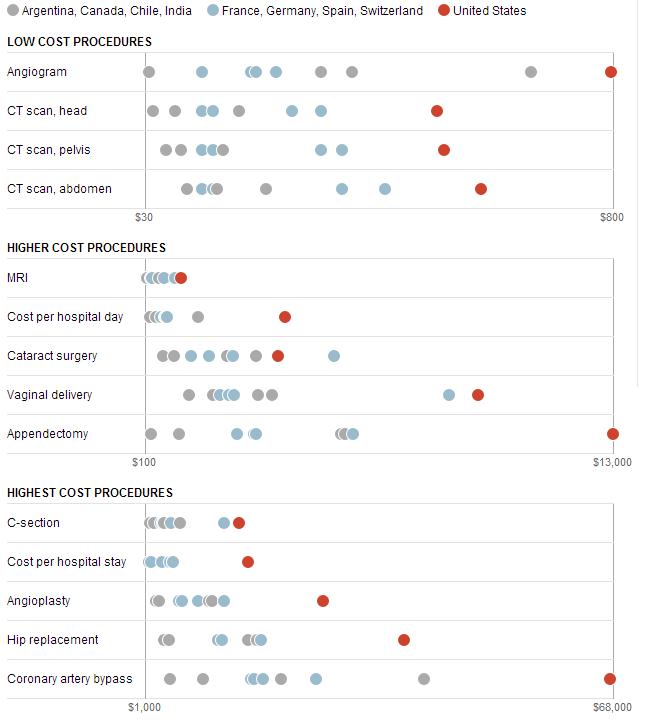
The Washington Post has provided some data on medical costs across a selection of countries (Argentina, Canada, Chile, and India in grey; France, Germany, Switzerland, and Spain in blue; and the U.S. in red). The data reveal that American health care is very expensive compared to other countries.

1

No wonder the US spends twice as much as France on health care.  In 2009, the U.S. average was $8000 per person; in France, $4000.  (Canada came in at $4800).  Why do we spend so much?  Ezra Klein quotes the title of a 2003 paper by four health-care economists:  “it’s the prices, stupid.”

And why are US prices higher?  Prices in the other OECD countries are lower partly because of what U.S. conservatives would call socialism – the active participation of the government.  In the U.K. and Canada, the government sets prices.  In other countries, the government uses its Wal-Mart-like power as a huge buyer to negotiate lower prices from providers.  (If it’s a good thing for Wal-Mart to bring lower prices for people who need to buy clothes, why is it a bad thing for the government to bring lower prices to people who need to buy, say, an appendectomy? I could never figure that out.)

There may also be cultural differences between the U.S. and other wealthy countries, differences about whether greed, for lack of a better word, is good.  How much greed is good, and in what realms is it good?  Klein quotes a man who served in the Thatcher government:

Health is a business in the United States in quite a different way than it is elsewhere.  It’s very much something people make money out of. There isn’t too much embarrassment about that compared to Europe and elsewhere.

So we Americans roll along, paying several times what others pay for medical procedures, doctor visits, and drugs.

Jay Livingston is the chair of the Sociology Department at Montclair State University. You can follow him at Montclair SocioBlog or on Twitter.

Cross-posted at Montclair SocioBlog.

In the Pittsburgh of my youth many decades ago, Rolling Rock was an ordinary, low-priced local beer – like Duquesne (“Duke”) or Iron City. (“Gimme a bottle of Iron,” was what you’d say to the bartender.  And if you were a true Pittsburgher, you pronounced it “Ahrn.”).  The Rolling Rock brewery was in Latrobe, PA, a town about forty miles east whose other claim to fame was Arnold Palmer. The print ads showed the pure sparking mountain stream flowing over rocks.

1

That was then.  In the late 1980s, Rolling Rock started expanding – geographically outward and socially upward.  Typically, when ideas and fashions diffuse through the social class structure they flow downward. Less frequently, the educated classes embrace an artifact of working-class culture. But why?  Their conspicuous consumption (or “signalling,” as we now say) is saying something, but what ideas about themselves and the social landscape are they expressing with their choice of beer?

I had an e-mail exchange about that question with Keith Humphreys, who blogs at The Reality-Based Community.  He too grew up in western Pennsylvania, and we both recalled being surprised years later to see Rolling Rock as a beer of choice among young stock traders and other decidedly non-working-class people.  But we had different ideas as to what these cosmopolitans thought they were doing.  Keith saw it as their way of identifying with the working class.

Those of us who grew up near Latrobe, Pennsylvania are agog when upscale hipsters who could afford something better drink Rolling Rock beer as a sign of their solidarity with us.*

I was more skeptical.  I saw it as the hipsters (or before them, the yuppies) trying to be even more hip – so discerning that they could discover an excellent product in places everyone else had overlooked.  Rolling Rock was a diamond in the rough, a Jackson Pollock for $5 at a yard sale.  The cognoscenti were not identifying with the working-class. They were magnifying the distance.  They were saying in effect, “Those people don’t know what a prize they have.  But I do.”

I had no real data to support that idea, so I asked Gerry Khermouch, who knows more about beverage marketing than do most people.  His Beverage Business Insights puts out industry newsletters, and he writes for Adweek and Brandweek.  He’s also beverage buddies with the guys who changed Rolling Rock marketing.  Here’s what he said,

[F]ar from expressing solidarity with the working class, urban drinkers far afield regarded it as an upscale icon in much the way that Stella Artois has claimed today — a triumph of pure marketing.

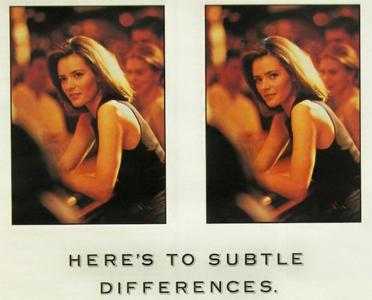
One ad campaign in the 90s, “Subtle Differences,” aimed directly at the drinker’s connoisseur fantasies.  Here are two examples:

2

3
It’s the little nuances that make life more interesting. Rolling Rock uses slightly more malt than other domestic golden lagers for a refreshing taste that’s got a little more body, a little more bite. If you’ve noticed, we salute you.

Words like nuance were hardly an appeal to solidarity with the working-class.  Neither was the strategy of raising the price rather than lowering it.

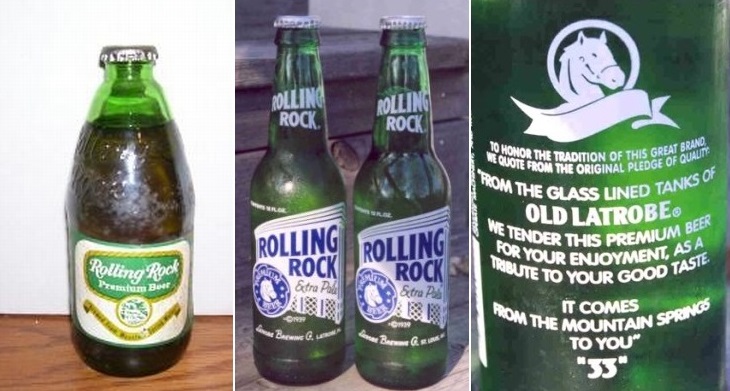
To the marketers, the nuance, the malt, bite, and body didn’t count for much.  Their big investment was in packaging.  Instead of stubby bottles with paper labels, they returned to the long-necked, painted-label bottles with the mysterious “33” on the back. Apparently, the original packaging, the  “Old Latrobe” reference, and the rest added notes of working-class authenticity.

4

As for the actual beer inside those bottles, it may have once been what the ad copy said.  The brewers had tried to overcome the “watery” image from the beer’s early water-over-the-rocks imagery.  But when Anheuser-Busch bought the company in 2006, they closed the Latrobe brewery, and Rolling Rock became a watery, biteless product indistinguishable from the other innocuous lagers that dominate the US market.

* This was an aside in a post about the future of the marijuana market.  See also our post about the resurgence of Pabst Blue Ribbon.

Jay Livingston is the chair of the Sociology Department at Montclair State University. You can follow him at Montclair SocioBlog or on Twitter.

Originally posted in 2010. Re-posted in honor of Women’s History Month.

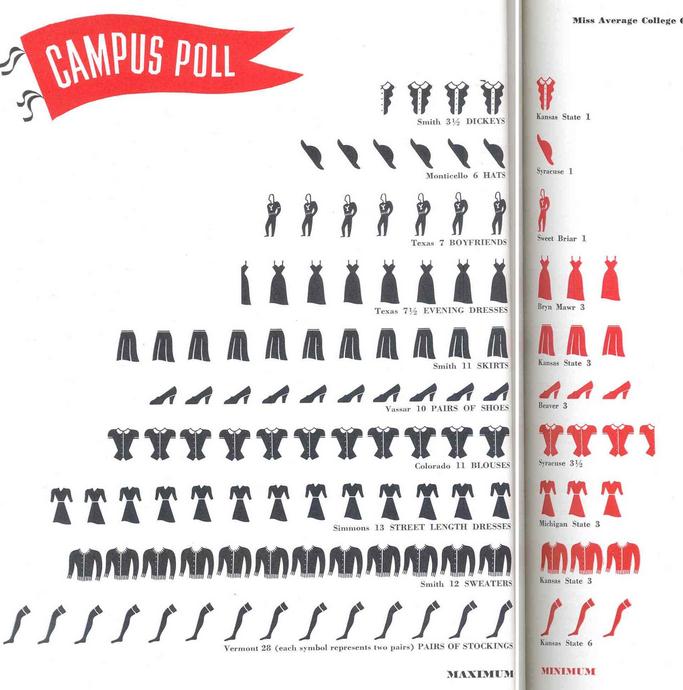
The New York Public Library posted a page from the first issue (September 1941) of Design for Living: The Magazine for Young Moderns that I thought was sorta neat for bringing some perspective to the increase in the amount and variety of clothing we take as normal today–but also, to my relief, the acceptance of a more casual style of dress. The magazine conducted a poll of women at a number of colleges throughout the U.S. about how many of various articles of clothing they owned. Here’s a visual showing the school where women reported the highest and lowest averages (the top item is a dickey, not a shirt):

1

Overall the women reported spending an average of $240.33 per year on clothing.

Hats for women were apparently well on their way out of fashion:

Can you imagine a magazine aimed at college women today implying that you might be able to get away with only three or four pairs of shoes, even if that’s what women reported?

At the end of the article they bring readers’ attention to the fact that they used a sample:

I can’t help but find it rather charming that a popular magazine would even bother to clarify anything about their polling methods. So…earnest!

Gwen Sharp is an associate professor of sociology at Nevada State College. You can follow her on Twitter at @gwensharpnv.

Dylan Matthews, blogging in the Washington Post, discusses a very interesting paper that provides evidence showing that politicians seriously underestimate the progressivity of their constituents.

David Broockman and Christopher Skovron, the authors of the paper, “surveyed every candidate for state legislative office in the United States in 2012 [shortly before the November election] and probed candidates’ own positions and their perceptions of their constituents’ positions on universal health care, same-sex marriage, and federal welfare programs, three of the most publicly salient issues in both national-level and state-level American politics during the past several years.”  They then matched the results with estimates of the actual district- and issue-specific opinions of those residing in the candidates’ districts using a data set of almost 100,000 Americans.

Here is what they found:

Politicians consistently and substantially overestimate support for conservative positions among their constituents on these issues. The differences we discover in this regard are exceptionally large among conservative politicians: across both issues we examine, conservative politicians appear to overestimate support for conservative policy views among their constituents by over 20 percentage points on average… Comparable figures for liberal politicians also show a slight conservative bias: in fact, about 70% of liberal office holders typically underestimate support for liberal positions on these issues among their constituents.

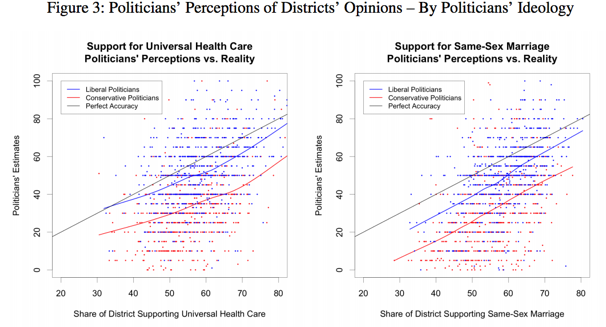
The following two charts illustrate this bias when it comes to universal health care and same sex marriage.

1

As Matthews explain:

The X axis is the district’s actual views, and the Y axis their legislators’ estimates of their views. The thin black line is perfect accuracy, the response you’d get from a legislator totally in tune with his constituents. Lines above it would signify the politicians think the district more liberal than it actually is; if they’re below it, that means the legislators are overestimating their constituents’ conservatism. Liberal legislators consistently overestimate opposition to same-sex marriage and universal health care, but only mildly. Conservative politicians are not even in the right ballpark.

The authors found a similar bias regarding support for welfare programs.  Perhaps even more unsettling, the authors found no correlation between the amount of time candidates spent meeting and talking to people in their districts while campaigning for office and the accuracy of their perceptions of the political positions of those living in their districts.

One consequence of this disconnect is that office holders, even those with progressive views, are reluctant to take progressive positions.  More generally, these results speak to a real breakdown in “the ability of constituencies to control the laws that their representatives make on their behalf.”

Martin Hart-Landsberg is a professor of economics at Lewis and Clark College. You can follow him at Reports from the Economic Front.

Originally posted in 2008. Re-posted in honor of Women’s History Month. Cross-posted at Racialicious.

The marketing for beach-related vacation destinations often capitalizes on the association of foreign beaches with (partly) naked bathing beauties. This intersection of race, gender, and sexuality that positions the “ethnic” woman as particularly sexually accessible have deep roots in our colonial past in which foreign lands “open” to conquest by the Western world were conflated with foreign women “open” to conquest by Western men.

The “Hula Girl” is a case in point.

Hawaii was colonized by the U.S. and, when the islands became a tourism destination, Polynesian women were transformed into Hawaiian babes ready and waiting to please tourists from the mainland.

One transformation was the hula. Widely understood to be an “authentic” Polynesian tradition, the hula was actually originally mostly a man’s dance. It was religious. It involved chanting and no music. There were no hip movements, just gestures. Basically, it was story-telling.

Today, the men take a back seat to women, who are scantily clad in grass skirts (not authentic, by the way), and perform exaggerated hip movements to music. So the hula is an invention, designed by colonizers and capitalists, to highlight the appeal of “foreign” women.

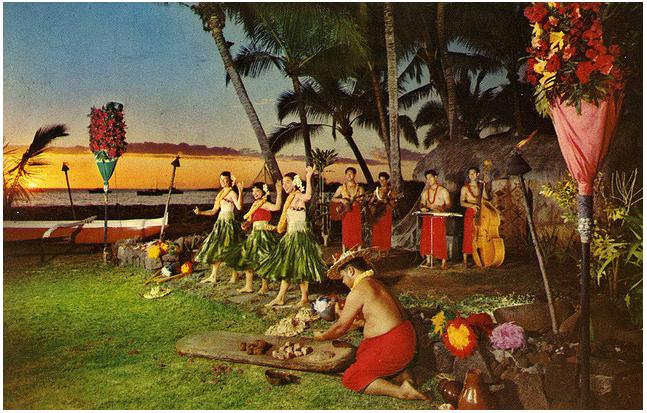
Despite the constructed nature of the hula girl, she’s been used to market Hawaii for over 100 years.  Here is an image of hula girls sent back to the mainland way back in 1890:

And from the 1940s (from IslandArtCards):

1

1965, via Jassy-50:

1

This picture was snapped by my friend Jason at a Trader Vic’s restaurant in 2008:

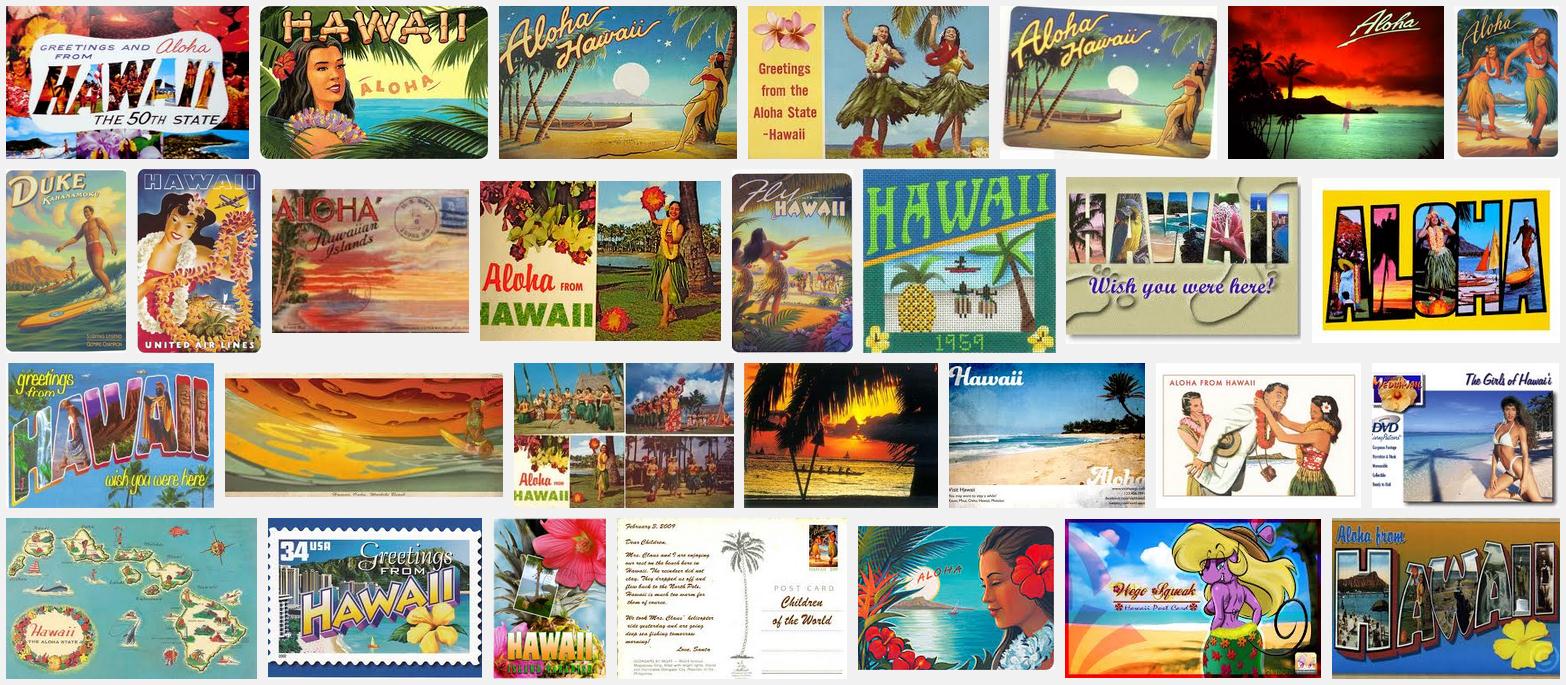
A Google Image search for “Hawaii postcard” in 2013 reveals that about half include the figure of a woman:

1

The phenomenon is a common one: women are treated as objects of beauty and aesthetic pleasure — exotified, in the case of “foreign” or darker-skinned women — and used to embellish a place or experience.  While lots of things have changed for women since the beginning of this particular example in the late 1800s, their role as decoration resists retirement.

Lisa Wade, PhD is an Associate Professor at Tulane University. She is the author of American Hookup, a book about college sexual culture; a textbook about gender; and a forthcoming introductory text: Terrible Magnificent Sociology. You can follow her on Twitter and Instagram.

In this short video, Mitchell Moffit and Gregory Brown of AsapSCIENCE discuss the neurological processes behind porn addiction. High levels of porn consumption, they argue, can create a feedback loop that molds sexual desires and behaviors.

Looking at porn, then, doesn’t just reflect a person’s existing desires and preferences; it’s a mechanism for creating new ones or channeling them in particular directions. This is the problem critics such as Cindy Gallop see with the narrow, unrealistic (and often violently misogynistic) set of messages about sexuality that porn offers us.

Gwen Sharp is an associate professor of sociology at Nevada State College. You can follow her on Twitter at @gwensharpnv.