
Yesterday I posted the news that the percent of Americans in poverty reached nearly 15% in 2009. Philip Cohen, at Family Inequality, used the same Census data to give us an idea of how both wealth and poverty are distributed across U.S. racial groups. We know that Blacks, Latinos, American Indians and some, but not all, Asian sub-groups are poorer, on average, than Whites. Cohen offers us a different way of looking at this, however, by plotting the income-to-needs ratio for Whites, Blacks, and Latinos over the last 8 years.
That income-need ratio is, by definition, 1.0 at the poverty line, and numbers above that are multiples of needs, so 3.0 is income of 3-times the poverty line.
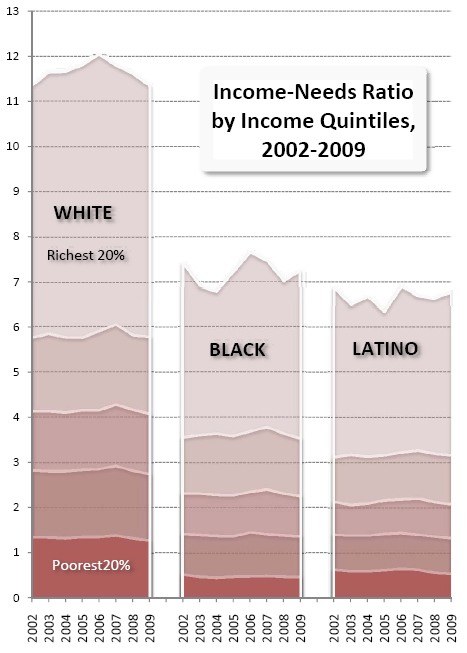
That ratio sits along the vertical axis, with time at the horizontal:
This, Cohen explains, “…allows us to see the size of the White advantage…” He continues:
So, for example, the richest 5th of Whites are above 11-times the poverty line, while the poorest 5th of Whites are (on average) just above the poverty line. In contrast, the richest 5th of Blacks and Latinos are around 7-times the poverty line, and 40% of both groups are below 1.5-times the poverty line.
It’s not simply, then, that Blacks and Latinos are disproportionately poor. Their poor are also poorer than the poor Whites and their rich are less rich than rich Whites.
Lisa Wade, PhD is an Associate Professor at Tulane University. She is the author of American Hookup, a book about college sexual culture; a textbook about gender; and a forthcoming introductory text: Terrible Magnificent Sociology. You can follow her on Twitter and Instagram.
Comments 25
Anonymous — September 18, 2010
The first question you have to ask yourself before even looking at the data is, "what does the author want to be true?". Once you understand that much it's easy to see why he selected the categories he did without mentioning their inherent limitations or the potential lurking variables. You provide the narrative and the numbers, when properly arranged, will provide the justification.
Ben — September 18, 2010
I know this isn't a graphical statistics forum, but I'm having trouble interpreting the graph. So the numbers on the Y axis are the ratio of the poorest to the richest. But the lines are based on the bottom 20% for white people. Just by eye-balling it, it seems that the poorest 20% for blacks is about 40% of that of whites. That means that the ratio of poor to rich for blacks is 14:1 to 16:1, and about 12:1 to 14:1 for latinos. I wonder what the graph would look like if it used absolute numbers isn't of ratios.
Anonymous — September 18, 2010
I'm curious what the Asian distribution looks like.
T — September 18, 2010
I'm very comfortable reading graphical representations like this... but... well, I don't know about this graph. It's a tough one to read, and I'm not sure it actually says what the creator concludes (at least not as clear-cut)
I'm actually confident this is quite misleading. Using quintiles instead of absolute numbers, using averages without showing distribution of wealth, etc. This is all very problematic.
Are the poor really poorer? Or are there just more wealthy whites? (shifting the quintiles) There's big a difference here... and the 'solution' to the 'problem' is very different depending on which way you look at it. Is the goal to make more minorities rich (say, 12x poverty line) and then the distribution would look the same as the white graphs... but does nothing to help the actual poor?
Philip Cohen — September 18, 2010
Thanks for posting this, Lisa.
OK, I admit it's not the clearest graph. To make it understood, I always say, use a number from the graph in a sentence. Here are two sentences:
1. In 2009, the richest 20% of Black families had an average income-to-needs ratio of about 7. (That is, on average their income was 7-times the poverty line.)
2. In 2009, the poorest 205 of Black families had an average income-to-needs ratio of less than half the poverty line.
So the lines are the average (mean) for each group. The shaded areas unfortunately create the impression that the lines are upper limits for each group, when in fact they are averages. For income Census publishes upper limits, but for income-to-needs they seem to only do averages.
Income-to-needs is the concept used to make the poverty line. It's good because it is based on the number of people, by age, in each family. It's bad to the extent that both the income and the needs are not well defined.
I appreciate the comments.
Anonymous — September 18, 2010
The real problem is that statistics are meaningless to individuals. Sure they are important to sociologists, but for the average person who loses their home, or the middle aged workers whose job is not coming back, where they fit on a graph is irrelevant.
b — September 18, 2010
Wait, this implies that there are NO blacks or hispanics that make more than 8x the poverty level income? I have a hard time believing that. I'm sure that there are far, far fewer of them than there are whites, but this graph makes it look like they don't exist at all. It leaves me completely not understanding how they decided where to draw the top line.
Indignant Desert Birds » Sunday Morning Reading Material (Third Sunday in September) — September 19, 2010
[...] Classism in one graph. [...]
Getheren — September 19, 2010
(1) To what extent is the high income to needs ratio among whites skewed by the fact that upper-upper class people (defined as those in the top 5% income bracket) are overwhelmingly white? Enough extremely high incomes in the pool will shift all quintile boundaries upwards; conversely, an absence of numerous extreme high incomes will shift all quintile boundaries downwards. This graph may reflect racial disparities in distribution of wealth, but is that an artefact of racism, or is it an artefact of wealth concentration? My money (pardon the pun) is on the latter -- which is also a grievous injustice, but a class injustice rather than a racial one.
(2) For a truer and more comprehensive picture, it would be good to see the same sort of chart correlating income:needs ratio with other factors -- such as degreed status, parents' degreed status, SES, parents' SES, gender, status of family of origin (intact marriage, divorce during childhood, later divorce, single parent household), religion, geographical location, ethnic/national identity, native language, or physical/psychological challenges. Viewing a correlation on only one factor isn't terribly meaningful in such a complex context.
(3) That data would then give a basis for ensuring that comparisons are apple-to-apple -- that is, for teasing out the influence of other factors to give a clearer picture of the extent to which race, specifically, influences income:needs ratios.
T — September 19, 2010
Getheren -- your comments echoed mine and really reinforce that that this graph *appears* to show a lot more than it actually does. The shading is EXTREMELY problematic. It suggests a range and the lines are upper limits... when that's not at all what the graph is supposed to say. The shading is at best meaningless, but I believe it's actually very misleading. The average of each quintile (which is what the line represents) is interesting -- but really comparison between the racial groups is difficult... or at least anything particularly meaningful or useful.
Philip Cohen — September 19, 2010
I think T is getting a little carried away. The distributions within the quintiles can't be as extreme as you seem to think they are, because people who are at extremes within a quintile end up in the next quintile. Only the top quintile is very messed up by its internal distribution. That is, there are no rich people hiding in the lowest quintile, and no poor people hiding in the top!
There really is no doubt about the White quintiles stack up much higher than the others. If you just ignore the shading and look at the lines as averages, that point is still clear.
On the Asian data issue: I can't speak for others, but I would be happy to show Asian data if it were reliable, regardless of what it did to the narrative. The Current Population Survey just doesn't do a good job with the Asian population. The problems that exist with other groups (diversity in outcomes, national-origin backgrounds, etc.) are made much worse by the small sample size and the geographic administration of the sample. There are plenty of other sources for looking at Asians, including the decennial census and the American Community Survey. I have written on this, and am not trying to hide anything.
On women's employment: http://www.unc.edu/~pnc/SF07.pdf
On contemporary discrimination against Asians: http://www.unc.edu/~pnc/rrpe2002.pdf
On Asian representation among UNC faculty, I wrote: "Note also that Asians — especially men — are overrepresented as professors but underrepresented in top administration, a common pattern in which they fill the ranks of professional and managerial jobs, but not management." That's a reasonable summary for the largest Asian groups (http://familyinequality.wordpress.com/2010/09/07/ivorys-tower/)
Poverty, single mothers and race/ethnicity « Family Inequality — September 20, 2010
[...] particular, several readers of the Sociological Images repost of a figure I did on income-to-needs distributions thought it a problem that I had neglected to [...]
Do Asians in the U.S. have high incomes? « Family Inequality — June 25, 2012
[...] category (which I’ve done) or dropped from the story (which I’ve also done, angering some readers). Here is a typical passage, from a 2001 article by Leslie [...]
Do Asians in the U.S. have high incomes? « Welcome to the Doctor's Office — July 6, 2012
[...] one category (which I’ve done) or dropped from the story (which I’ve also done, angering some readers). Here is a typical passage, from a 2001 article by Leslie [...]