Time for another round-up of gendered kids’ items!

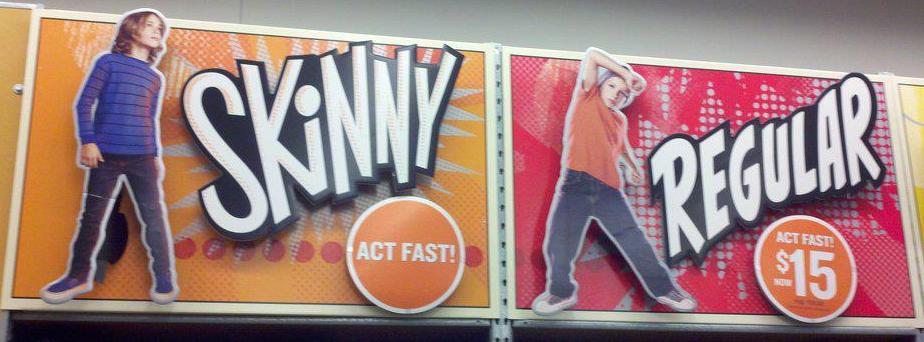
Will L. noticed something interesting recently at Old Navy. The boys’ section offered two styles of jeans, Skinny and Regular:

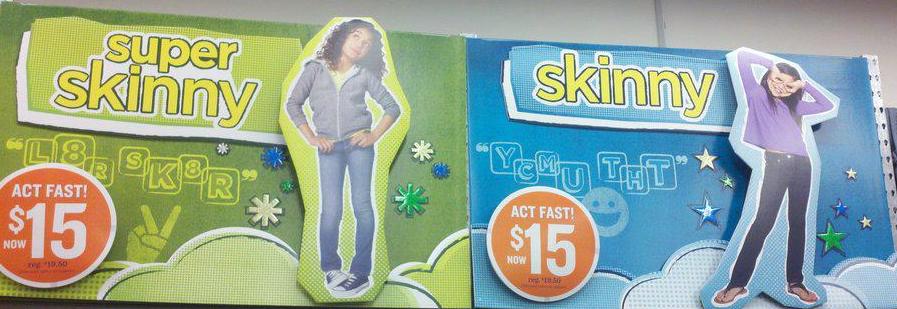
But when he looked at the corresponding section in the girls’ clothing, he found not Skinny and Regular, but Skinny and…Super Skinny:

Caro Reusch sent us an example of kids;’ t-shirts with messages about what we value for men and women. She saw the following at a mall in Berlin:

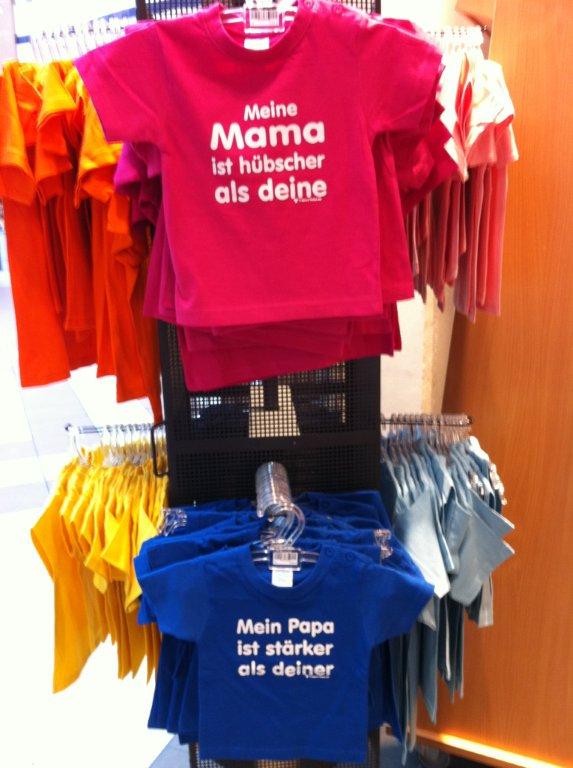
The blue one says “My daddy is stronger than yours,” while the pink announces, “My mommy is prettier than yours.”

Similarly, Lindsey B. saw two themed bibs for sale at Target. The blue bib is a doctor and the pink one is a ballerina:

Shantal Marshall, a postdoc student at UCLA with a Ph.D. in social psych and blogger at Smartie Pops, noticed that Crayola has a new product out, the Crayola Story Studio.  It lets you upload a photo of yourself, have it turned into a cartoon, and then it’s inserted into one of 3 themed templates: Disney Princess, Spiderman, or Cars. You can then print off various versions of coloring books based on those templates. The commercial for the Spiderman version shows a boy excitedly becoming a superhero:

For the Disney Princess version, we see a girl excited to become a princess, then dancing in the background with her very own Prince Charming:

As Shantal said, it’s a bit dispiriting that Crayola’s slogan for these items is “give everything imaginable,” but the pre-existing templates, and their marketing, don’t seem to include an imaginable alternative to the “boys = superheroes” and “girls = princesses” division we see so often in kids’ toys.

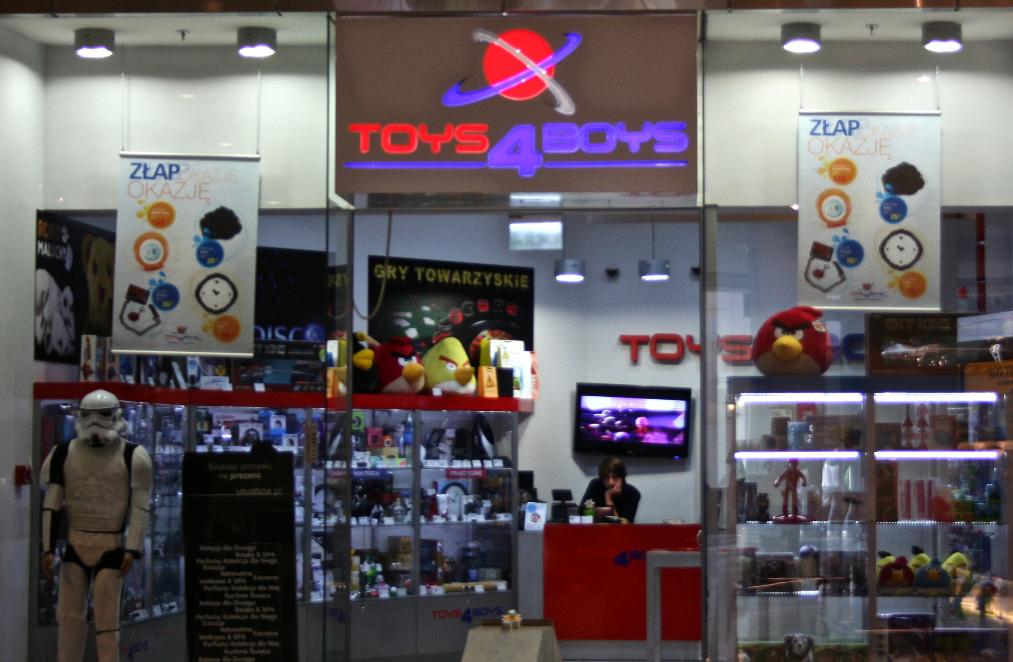
Madelyn C. saw a store in Warsaw, Poland, that just goes ahead and makes the gendered division of the toy industry explicit:

Finally, Jessica M. sent in a link to a GOOD post by Christopher Mims about the Toy Industry Association’s 2011 Toy of the Year Awards. There are general categories of toys, such as educational, innovative, and action, but of course also girl and boy categories (also, I personally can’t think of “boy toy of the year” without thinking of Madonna’s outfit in her “Like a Virgin” performance at the first MTV Video Music Awards, but maybe the ’80s are sufficiently behind us that the phrase resonates differently for most people). Anyway, Mims discusses the gendered messages in the commercials for the nominees in the two categories. Among other things, the categorization is rather confusing. Hexbugs are nominated in the boy category, even though commercials for them show girls as well:

Also, Mims points out that the boys’ category “includes a strong undercurrent of Beyond Thunderdome via WWE.” Exhibit A: The commercial for Beyblade Metal Masters, “performance tops” to be used in “strategic battles”:

Playing with tops has gotten super hardcore, I guess. Probably they should look into a sponsorship from an energy drink.

Katrin sent in an interesting example of an effort to (re)masculinize an occupation. Often when we see these efforts, they’re aimed at attracting men to traditionally-female jobs such as nursing by asserting that only “real men” would be able to handle the demands of the job, or emphasizing compatibility with masculinity.

In this case, the occupation that is being framed as highly masculine isn’t one dominated by women; it is, in fact, open only to men: the Catholic priesthood. The image, originally posted at NYPriest, is taken from Fishers of Men, a video released as part of the Archdiocese of New York’s Office of Vocations “The World Needs Heroes” campaign, meant to attract men to the priesthood:

Usually, a male-dominated occupation wouldn’t be in need of having its masculinized character stressed so openly. However, the child sex abuse scandals that have rocked the Catholic Church in the U.S. and elsewhere have damaged the image of the priesthood. Not only did many priests sexually abuse children, but many of the abused children where boys. Had the abuse involved primarily girls girls in late childhood or their teens, the public may very well have expressed revulsion and disgust, but we also have cultural narratives available, such as the idea of the sexually precocious Lolita who entices men against their better judgement, that are often used to at least partially justify or explain adult men’s sexual attraction to or abuse of even young girls (such as the judge who, in 1982, called a 5-year-old rape victim “unusually sexually promiscuous” and gave the adult man who assaulted her only 90 days in a work-release program).

But the fact that so many victims were boys meant those cultural narratives, which implicitly reinforce assumptions about adult masculine sexuality (men can’t quite control themselves; they’re easily led astray by female temptresses, even inappropriately young ones) didn’t apply. Abusing boys undermines the assumption of heterosexuality that is essential to hegemonic masculinity.

Given this social context, it’s not surprising that the NY Archdiocese felt the need to reassert the priesthood as masculine as one element of their image rehabilitation campaign.

With the college football championship games coming up, Dmitriy T.M. thought it was a good time to highlight the NCAA’s database that provides detailed information on graduation rates of college athletes. For each school, you can select particular sports and years. I decided to look up graduation rates for 2010-2011 at the two schools I attended: University of Oklahoma (undergrad) and University of Wisconsin-Madison (grad school).

The database reports two numbers. The Federal Graduation Rate (FGR) reports numbers for individuals who were first-time college students when they enrolled at the institution (that is, no transfer students are included, and students who transfer count negatively in the rate for their initial school, the equivalent of a drop-out); the FGR indicates how many students graduated from their initial institution within 6 years. The Graduation Success Rate (GSR) takes into account transfer students; as long as they’re in good academic standing when they transfer, they aren’t counted against the initial school’s graduation rate.

So how are student athletes doing? According to the NCAA’s analysis, if we look at the  more restrictive FGR for students who began college in 2004, student athletes actually have higher graduation rates in general, especially for African Americans:

If we switch to looking at the GSR (which, again, drops transfers from the data for the initial school, rather than counting them as non-graduates), for students who began college in 2003 and 2004, overall graduation was pretty high (79 and 82 percent), but we see pretty wide disparities. White student athletes were significantly more likely to graduate than African Americans, and for both races, women were more likely to graduate than men:

Graduation rates also vary by sport. Here are the averages for male athletes who enrolled between 2000 and 2003; we see basketball and football at the lower end, while lacrosse graduated 88% of its players from that period (the two football #s refer to the different divisions):


Female athletes from the same cohorts; the only sport where they didn’t have (usually significantly) higher graduation rates than men playing the same sport is rifle:

Ten-year trends for men in Division I schools in the “big three” sports:

There’s lots more detailed info available if you click the “Trends in Graduation Success Rates and Federal Graduation Rates at NCAA Division I Institutions” link at the top of the website; you can also get reports for particular schools broken down by sport, race/ethnicity, sex, etc.

The Centers for Disease Control and Prevention’s National Center for Injury Prevention and Control recently released a report on domestic violence and sexual assault in the U.S. The National Intimate Partner and Sexual Violence Survey 2010 Summary Report presents the results of phone surveys (targeting both landlines and cells) of 18,049 randomly-selected adults conducted in 2010. The results are predictably depressing: 18.3% adult women have experienced rape (defined as attempted or completed forced penetration) in their lifetimes (for men, it’s 1.4%):

Undermining the stranger rapist myth, the report found that the vast majority of perpetrators were acquaintances or partners of their victims.

As has been found in other studies, Native American women are more at risk than other racial group for sexual assault; in this study, those identifying multiracial had the highest rates of all:

Almost a third of women who are raped are victimized before they’re 18, while over a third are young adults aged 18-24:

Risk of rape varies significantly by state, though in no state did fewer than 10% of women report being raped. Virginia had the lowest levels of victimization of women, at 11.4%; other states on the low end include Tennessee, Delaware, and Rhode Island. Worst was Alaska, at 29.2%, with Oregon not far behind at 27.2% and Nevada at 26.1%.

The report also include information on stalking and domestic violence; 16.2% of women and 5.2% of men report at least one incident, overwhelmingly from an intimate partner, while over 30% of women and 25% of men have been slapped, shoved, or pushed by a partner.

It is a singularly depressing read about the state of men’s and women’s intimate lives.

Back in November, Conan O’Brien officiated at the wedding of two gay men on his show. This received a decent bit of media coverage, it being the first time a same-sex couple was married on TV. My friend John McQuiston pointed out a great video showing the intros of many stations’ coverage of the story. John says CBS Newspath released a tease with the phrase “pushing the envelope,” and the phrase stuck. The clip illustrates the way that, despite the many media outlets available to us, norms of news reporting (and, according to John, general laziness) mean that we often hear the same message or framing of issues repeated over and over, reinforcing a particular understanding of events to the exclusion of other interpretations:

As we enter the last frenzied days of Christmas shopping, Dmitriy T.M. thought it was worth looking at international comparisons in spending on the holiday. The Economist posted a graph based on Gallup polls and other data sources about how much individuals in various countries in Europe, plus the U.S. and South Africa, plan to spend on Christmas shopping this year, plotted against national GDP. Overall, Christmas spending correlates with national wealth, with the Netherlands being a noticeable outlier (spending less than we’d expect) and Luxembourg in a spending league of its own:


As examples of childhood socialization into cultural patterns of interaction, we’ve previously brought you baby preacher, baby worshipper, and two babies mimicking a conversation. Thanks to Shruti S., we now have another awesome example: a 2-year-old, Khaliyl Iloyi of London, who has learned the cadences of rapping:

You’re welcome.

Dmitriy T.M. sent in a Census Bureau report on transportation and commuting, providing a detailed picture of how we’re getting to work. Despite constant discussions about reducing car use and encouraging mass transportation, the vast majority of people in the U.S. get to work in a car:

Not surprisingly, there are significant differences by race and ethnicity. Non-Hispanic Whites are the most likely to drive to work alone in their own car (83.5%), while only 3.2% use public transportation. Latinos are the most likely to carpool with at least one other person (16.4%) and African Americans are most likely to use public transportation (11.5%):

These differences likely reflect a variety of factors, include social class and differences in racial/ethnic concentrations in urban vs. rural areas and in different regions of the U.S., which affects how likely a worker is to have access to reliable, efficient public transportation or to realistically be able to walk to work. In fact, there were only five metro areas where at least 10% of workers use public transportation to get to work: the regions surrounding NYC, San Francisco/Oakland, Washington D.C., Boston, and Chicago.

And as anyone who has taken part in a morning commute recently won’t be shocked to hear, leaving for work is still highly concentrated in the 5 to 8:59 a.m. period for most occupations, though departure times reflect the  wider range of normal working hours in the service industry compared to other economic sectors (note that the colors do not all represent equal amounts of time):

More on mode of transportation and commuting times by region and race/ethnicity in the full report.