Archive: Jun 2012

Yesterday I posted about the extraordinary number of people in Louisiana prisons.  The rise in imprisonment mirrors the U.S. growth that began with the so-called war on drugs, but was also triggered by a crisis in the early 1990s, after two decades of growth.  A federal court ordered Louisiana to reduce overcrowding in prisons, which had risen to an inhumane level.  They  had to either let criminals out or build more prisons.  They did the latter.

Instead of building more state-funded prisons, though, for-profit prisons were built by sheriffs and residents of local parishes.  Today there are more inmates housed in local, for-profit prisons than in state prisons (left) and Louisiana has more inmates in private prisons than any other state in the U.S. (right):

Why should we care if so many prisoners are housed in private, for-profit institutions?

The conditions in these prisons are worse than those in state prisons, especially when it comes to quality of life (like the opportunity to develop hobbies or practice their religion) and rehabilitative services (like high school equivalency classes and job training). These are desperately needed services; the average Louisiana prisoner has a 7th grade education and nearly a 3rd read below a 5th grade level:

State facilities simply spend more money, while for-profit prisons skim as much off the top as possible.  Writes reporter Cindy Chang:

An inmate at the Angola state penitentiary costs $63.15 a day, compared with the $24.39 sheriff’s per diem. State facilities house the sickest and oldest, but [Department of Corrections] Secretary Jimmy LeBlanc admits part of the differential is the lack of educational offerings.

In fact, Louisiana spends less on its prisoners (in state and private facilities combined) than any other state in the U.S.:

Law enforcement officials and parish residents may not like what’s happened in Louisiana, but many feel trapped.  For-profit prisons are sustaining local communities: they fund police departments and employ residents. Often they are the only local jobs with decent wages and benefits. Those residents support the local economies and keep small towns alive.

In this short video, an employee talks about the occupational opportunity the prison provides:

Many Louisianans, then, see the harsh sentences and high imprisonment as a price worth paying.  Says Sheriff Charles McDonald: “I know it sounds crazy and impersonal… but we’re stuck with this jail. We can’t walk away. We’ve got investors, employees.”

Lisa Wade, PhD is an Associate Professor at Tulane University. She is the author of American Hookup, a book about college sexual culture; a textbook about gender; and a forthcoming introductory text: Terrible Magnificent Sociology. You can follow her on Twitter and Instagram.

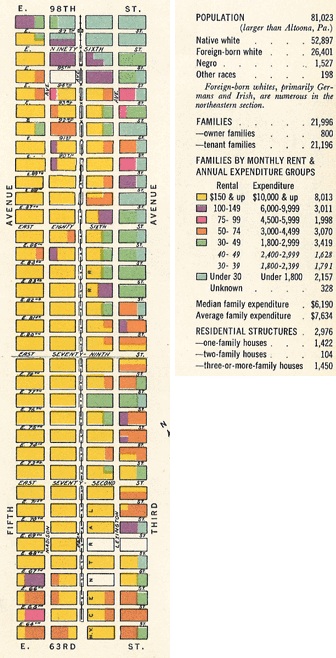
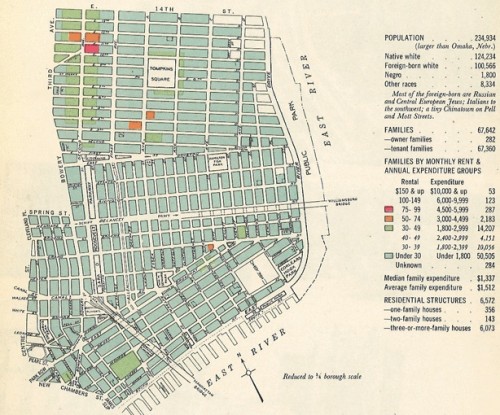
In the early 1940s, four news organizations — the New York Times, the Daily Mirror, News Syndicate Co. (now the Tribune Company), and Hearst Consolidated Publications — collaborated on a detailed market analysis of New York City, complete with statistics about racial/ethnic makeup, color-coded maps of rents, and photos and short narratives of each neighborhood. The Center for Urban Research, at the City University of New York (CUNY) Graduate Center, recently posted the resulting 1943 document, Market Analysis. The interactive archive is a treasure trove of information about New York in the 1940s.

Described as the “district of the silver spoon,” the Upper East Side, then as now, was among the most affluent neighborhoods, with many rents above the then-exorbitant $150 mark (now about $2,500):

The description points out that even in this affluent area, the rich and poor lived in close proximity, with $30/month apartments within a block of some of the most expensive real estate in the city.

The Lower East Side, on the other hand, is described as “the most populous, most crowded, most old-world district in New York City,” with so many immigrants that its atmosphere is “essentially alien”:

The narrative provides some information about urban planning policies of the time, as well. It notes that the Lower East Side had dropped by over 200,000 in 20 years, noting that “slum clearance” had led to more open public space; it also mentions the emergence of large housing developments, such as Knickerbocker Village — the type of large housing projects, often financed with government funding, that became the preferred solution to providing low-income housing, often leading to the displacement of many low-income residents when their residences were torn down to make room for the developments.

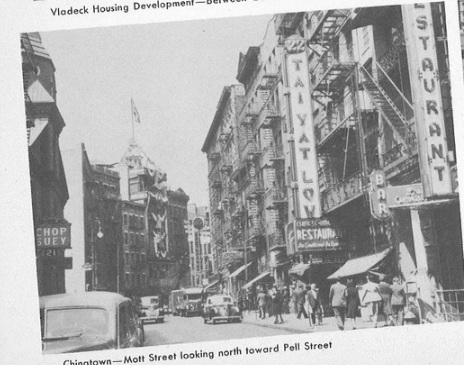
The “tiny Chinatown” that then existed on the Lower East Side at Pell and Mott Streets:

You get the idea. Clicking around for a while provides lots of interesting tidbits to illustrate major demographic, economic, and public-policy changes and how they have impacted life in the city. The Center for Urban Research has also provided a comparison of a number of characteristics between 1940 and today.

Several times we have posted images that reflect the realities of life within the U.S. prison system — for instance, photos of the impacts of overcrowding, life in juvenile detention centers, prison cemeteries, and the fate of prisoners during Hurricane Katrina. Alexander A. sent in a link to another striking collection of images of the corrections system. Josh Begley, a master’s student at NYU, collected aerial views of correctional facilities available from Google. His resulting project, Prison Map, makes visible an element of our society that most people rarely think about as actual, physical locations existing on the landscape. I’ve picked a few examples here, but I highly recommend going to the Prison Map website and looking at it in its entirely, which allows you to pick up on common patterns in the design of prisons.

Also check out the article about the Prison Map project at The Atlantic.

A new 8-part Times Picayune series on the prison industry in Louisiana starts off with these foreboding sentences:

Louisiana is the world’s prison capital. The state imprisons more of its people, per head, than any of its U.S. counterparts. First among Americans means first in the world. Louisiana’s incarceration rate is nearly five times Iran’s, 13 times China’s and 20 times Germany’s.

One out of every 86 Louisianans is in prison.

The motivation is money.   Most prisoners in Louisiana are in for-profit prisons.  The state spends $663 million a year on imprisonment; $182 million of that goes to for-profit correctional companies or contracted local sheriffs.  Many small towns depend on the prisons to fund their law enforcement.

Burk Foster, a criminologist who’s been studying Louisiana prisons, explains:

They don’t want to see the prison system get smaller or the number of people in custody reduced, even though the crime rate is down, because the good old boys are all linked together in the punishment network, which is good for them financially and politically.

State Rep. Joseph Lopinto (R-Metairie) agrees:

The bottom line is, if locking everybody up and throwing away the key works, then we should have the lowest crime rate in the United States. We don’t. So then you have to really look at your policies. In my opinion, it’s strictly a fiscal issue.

Those who benefit from the prison industry have pushed through some of the severest sentencing laws in the country and aggressively resist reform.  “Few lobbies in Louisiana,” writes reporter Cindy Chang, “are as powerful as the sheriffs association.”  As a result, Louisiana’s sentencing laws are out-of-step with the rest of the country:

All life sentences are, automatically, without any chance of parole and more than one in ten Louisiana prisoners are serving life sentences (the majority of lifers were convicted before age 30):

Harsh where other states are lenient, and harsh where other states are harsh, Louisiana has “a much higher percentage behind bars for [non-violent] drug offenses.”  In 2009, 82% of the 17,223 new admissions to Louisiana prisons were convicted of non-violent felonies.

Tomorrow I’ll follow up with a post on why there are so many for-profit prisons in Louisiana and how it’s affected the lives of prisoners both during and after incarceration.

Lisa Wade, PhD is an Associate Professor at Tulane University. She is the author of American Hookup, a book about college sexual culture; a textbook about gender; and a forthcoming introductory text: Terrible Magnificent Sociology. You can follow her on Twitter and Instagram.

Cross-posted at Montclair SocioBlog.

I’m not sure what effect prime-time sitcoms have on the general public.  Very little, I suspect, but I don’t know the literature on the topic.  Still, it’s surprising how many people with a similar lack of knowledge assume that the effect is large and usually for the worse.

Isabel Sawhill, is a serious researcher at Brookings; her areas are poverty and inequality.  Now, in a Washington Post article, she, says that Dan Quayle was right about Murphy Brown.

Some quick history for those who were out of the room — or hadn’t yet entered the room: In 1992, Dan Quayle was vice-president under Bush I.  Murphy Brown was the title character on a popular sitcom then in its fourth season — a divorced TV news anchor played by Candice Bergen.  On the show, she got pregnant.  When the father, her ex, refused to remarry her, she decided to have the baby and raise it on her own.

Dan Quayle, in his second most famous moment,* gave a campaign speech about family values that included this:

Bearing babies irresponsibly is simply wrong… Failing to support children one has fathered is wrong… It doesn’t help matters when prime-time TV has Murphy Brown, a character who supposedly epitomizes today’s intelligent, highly paid professional woman, mocking the importance of fathers by bearing a child alone and calling it just another lifestyle choice.

Sawhill, citing her own research and that of others, argues that Quayle was right about families:  children raised by married parents are better off in many ways — health, education, income, and other measures of well-being — than are children raised by unmarried parents whether single or together.**

But Sawhill also says that Quayle was right about the more famous part of the statement – that “Murphy Brown” was partly to blame for the rise in nonmarried parenthood.

Dan Quayle was right. Unless the media, parents and other influential leaders celebrate marriage as the best environment for raising children, the new trend — bringing up baby alone — may be irreversible.

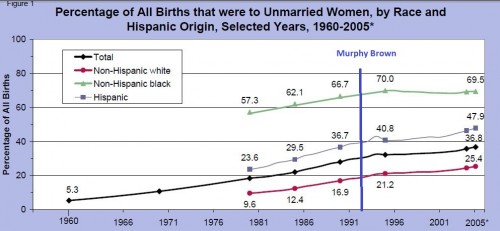
Sawhill, following Quayle, gives pride of place to the media.  But unfortunately, she cites no evidence on the effects of sitcoms or the media in general on unwed parenthood.  I did, however, find a graph of trends in unwed motherhood. It shows the percent of all babies that were born to unmarried mothers.  I have added a vertical line to indicate the Murphy Brown moment.

The “Murphy Brown” effect is, at the very least, hard to detect. The rise is general across all racial groups, including those who were probably not watching a sitcom whose characters were all white and well-off.  Also, the trend begins well before “Murphy Brown” ever saw the light of prime time.  So 1992, with Murphy Brown’s fateful decision, was no more a turning point than was 1986, for example, a year when the two top TV shows were “The Cosby Show” and “Family Ties,” sitcoms with a very low rate of single parenthood and, at least for “Cosby,” a more inclusive demographic.

————————

  * Quayle’s most remembered moment: when a schoolboy wrote “potato” on the blackboard, Quayle “corrected” him by getting him to add a final “e” – “potatoe.”  “There you go,” said the vice-president of the United States approvingly. (A 15-second video is here.)

** These results are not surprising.  Compared with other wealthy countries, the US does less to support poor children and families or to ease the deleterious effects on children who have been so foolhardy as to choose poor, unmarried parents.

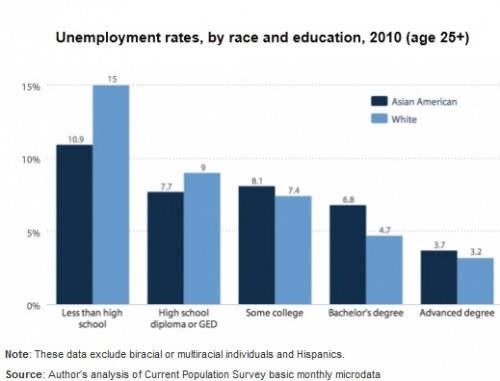
The Economic Policy Institute recently released a report looking at the impacts of the recession and its aftermath on the Asian American population. Due to the model minority stereotype, Asian Americans are often overlooked in discussions of the economic crisis or of poverty and inequality more broadly.  It is true that Asian Americans have generally had lower unemployment rates than other racial/ethnic groups, due to their overall higher educational levels. However, if we look within educational levels beyond a high school diploma, Asian Americans have higher unemployment rates than comparable Whites, with the gap widest for those with bachelor’s degrees:

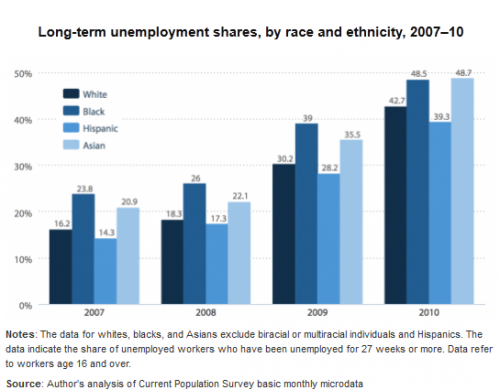
The economic difficulties faced by some Asian Americans is even more noticeable when we look at long-term unemployment (joblessness that lasts 27+ weeks, or more than about half a year). The proportion of the unemployed that fall into this category has risen for every group since 2007, with African-Americans and Asian-Americans more likely than Whites or Hispanics to be unemployed for long periods:

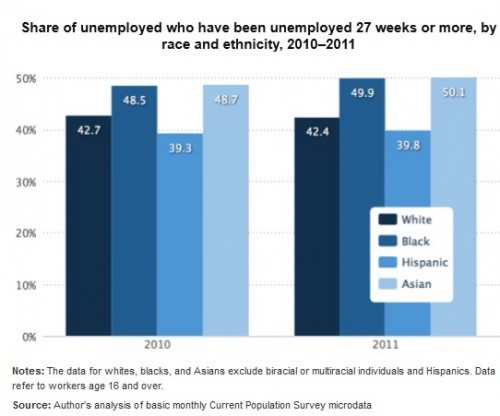
EPI then released an update to the report, incorporating 2011 data. Long-term unemployment has inched upward for every group; half of unemployed African- and Asian-Americans have now been out of work for at least 27 weeks:

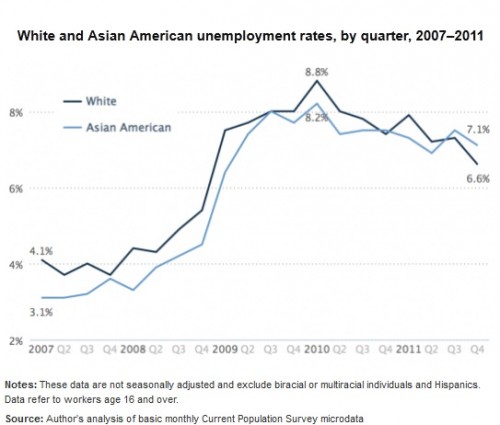
And in fact, despite their higher overall levels of education, Asian Americans now have a higher unemployment rate than Whites (though the rate for both groups is down from the peak in 2010):

For a discussion of factors that may contribute to these patterns among Asian Americans, such as their concentration in states particularly hard-hit by the recession and the proportion of the population that is foreign-born, see the full report.

Cross-posted at Family Inequality.

Lots of buzz over a New York Times article about men moving into female-dominated occupations, which reported that “more and more men are starting to see the many benefits of jobs long-dominated by women.”

The Times produced this table, which shows the fastest growing occupations for (for some reason) college-educated White men, ages 25-39:

The ones with the pink dots are 70% female or more. The increase of young college educated White men in these occupations over 10 years appears striking, but the numbers are small. For example, compare that increase of (round numbers) 10,000 young White male registered nurses to the 1,900,000 full-time year-round nurses there were in 2010.

Moreover, consider that increase of 10,000 nurses in light of the overall growth of registered nurses from 2000 to 2010: about 500,000. Overall, the representation of men among full-time year-round registered nurses increased from 9.4% to 10.3% during the decade.

The Times article attempts to describe a broad trend of men moving into “pink-collar” jobs:

The trend began well before the crash, and appears to be driven by a variety of factors, including financial concerns, quality-of-life issues and a gradual erosion of gender stereotypes. An analysis of census data by The New York Times shows that from 2000 to 2010, occupations that are more than 70 percent female accounted for almost a third of all job growth for men, double the share of the previous decade.

Bold claims. But check the next sentence: “That does not mean that men are displacing women — those same occupations accounted for almost two-thirds of women’s job growth.” So, lots more men are in these jobs, but even more women are? How does that reflect an “erosion of gender stereotypes”? It seems like it reflects an increase in the size of female-dominated occupations.

In fact, as I reported briefly before, occupational gender segregation dropped barely a hair in the 2000s, from 51 to 50 on a scale of 0 to 100, compared with drops of 5 or 6 points in the decades before 1990. That is a lost decade for integration.

And if you look specifically at the category the Times chose — occupations that are 70% female or more — the percentage of men in those occupations increased, but only from 5.0% to 6.1%. And nurses? In 2010, 0.4% of all full-time year-round working men were nurses, up from 0.3% in 2000. Women are still 11-times more likely to be nurses than men.

Now that’s what you call a “gradual erosion of gender stereotypes.”

Sources: U.S. Census tables for 2000 and 2010 (table B24121).

In January the U.S. government announced a new definition of “forcible rape” to include male victims and oral or anal penetration in addition to vaginal. This has legal implications, of course, but also symbolic ones.  Language shapes how we experience the world, potentially changing how we feel about an event in our lives.  This happened to at least one person, prompting them to send in a postcard to Post Secret:

The more inclusive definition is a net good, I believe.  Legally, it’s best that we have the tools to prosecute these crimes and, for some people, being able to use this word to describe something terrible that happened to them will be validating and empowering.  For others, however, it may heighten the trauma. “Rape” is a powerful word and many Americans imagine it to be among the most harmful of crimes.  Like child abuse, but unlike even very violent non-sexual physical assaults, rape is often believed to be a long-lasting harm, maybe even one that you can never truly recover from.

Perhaps the word “dammit” in the card is meant to convey exactly this sentiment.  It was easier, perhaps, to think it was a bad night.  Now, though nothing has changed except for the language, the victim has to contend with having been raped.

Lisa Wade, PhD is an Associate Professor at Tulane University. She is the author of American Hookup, a book about college sexual culture; a textbook about gender; and a forthcoming introductory text: Terrible Magnificent Sociology. You can follow her on Twitter and Instagram.