work

These two Halloween costumes in a mall display, snapped by Deeky (here and here, via Shakesville), make a joke of women working in masculine occupations by suggesting that they’re, essentially, sex workers.

Captain Layover:

captlayover

Free Rides:

taxi

See our other Halloween-related posts: two extra-special costumes (the Anna Rexia costume and the Sexy Scholar), Max Weber jack o’lantern (by yours truly), Obama mask sold as terrorist mask, a Sarah Palin effigy, handling sex offenders on trick-o’-treat day, and costume catalog analyses (here and here).

—————————

Lisa Wade is a professor of sociology at Occidental College. You can follow her on Twitter and Facebook.

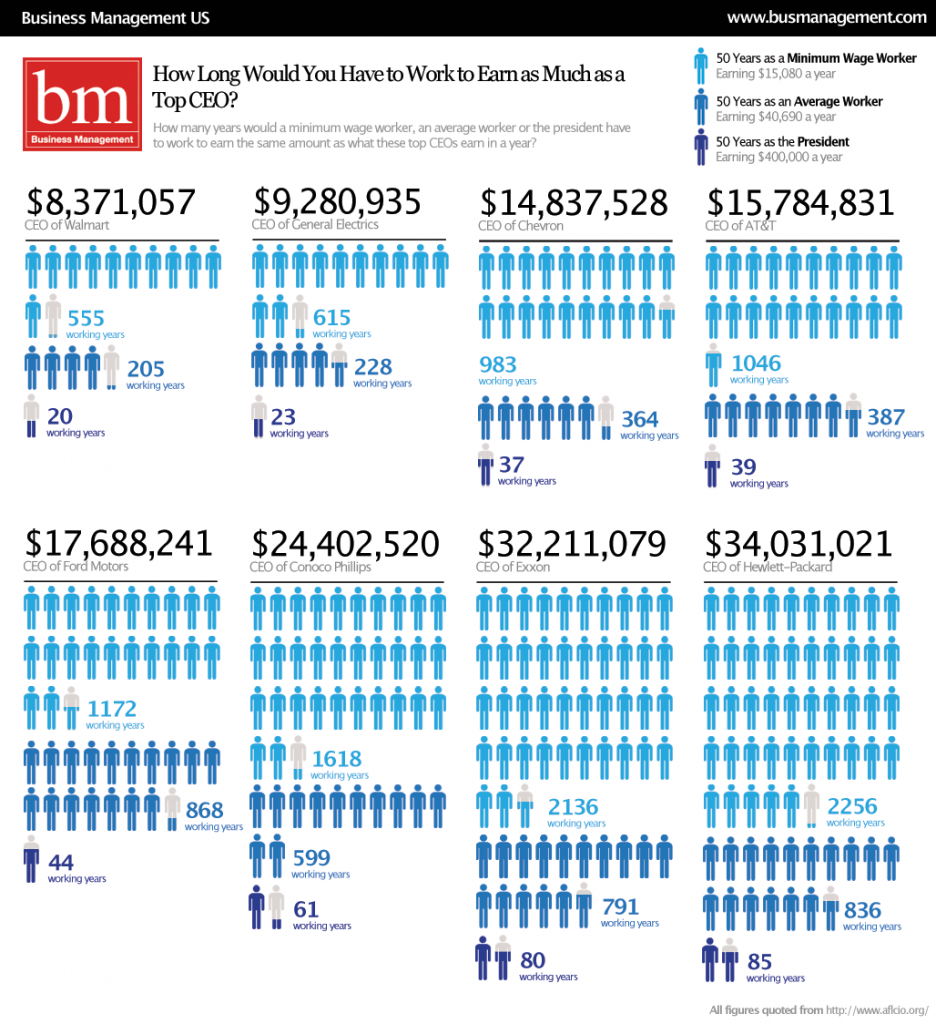
Business Management offers this great visual for understanding income in equality in the U.S.  Each light blue figure in this visual represents 50 years of work at minimum wage (making $15,080 a year); the medium blue figures represent 50 years of work at the average wage (making $40,690 a year); the dark blue figures represent 50 years as the President of the United States (making $400,000 a year).

090915-BMUS-PayRise2

Let’s take the most dramatic example, just for fun: Hewlett-Packard.

Capture

A minimum wage worker would have to work for 2,256 years to make what what the CEO of Hewlett-Packard makes in a year.

The average worker would have to work 836 years to match his yearly salary.

And Barack Obama would have to President for 85 years before he made what the CEO of Hewlett-Packard makes in one year.

See other posts on income inequality here, here, here, here, and here.

Via Chartporn.

—————————

Lisa Wade is a professor of sociology at Occidental College. You can follow her on Twitter and Facebook.

Stephen W. sent in an amazing 9-minute cartoon touting the superiority of capitalism:

—————————

Lisa Wade is a professor of sociology at Occidental College. You can follow her on Twitter and Facebook.

Mary M. of Cooking with the Junior League sent me a link to amalah.com, where you will find images from a 1962 textbook titled When You Marry (you can find the full text of the 1953 edition without photos here, and Larry found a full pdf of the 1962 edition here):

book 1

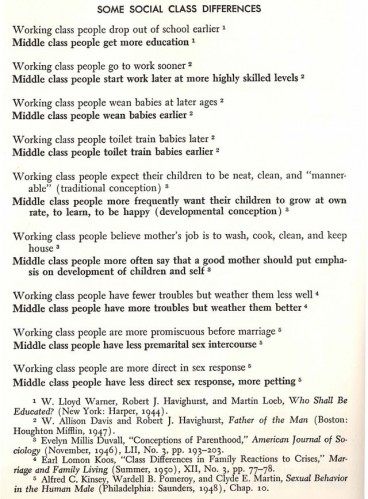
The book covers many aspects of dating and marriage and provides some fascinating insights into gender roles and social assumptions of the time. Here are some useful facts about social classes and families that you might like to know:

book 2

Working class people go to work sooner? Wow. Weird. But at least they have fewer troubles than the middle class. There are so many irritations you have to face when you aren’t poor, but at least you “weather” them well.

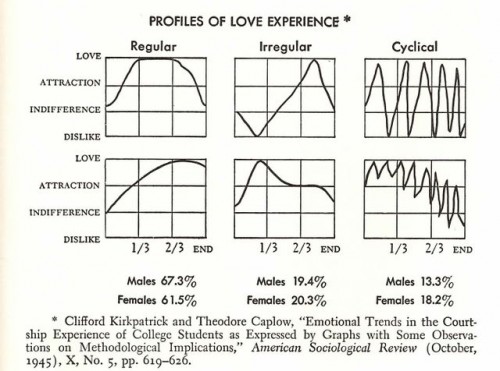
I may use this as an example of pointless graphs:

book 3

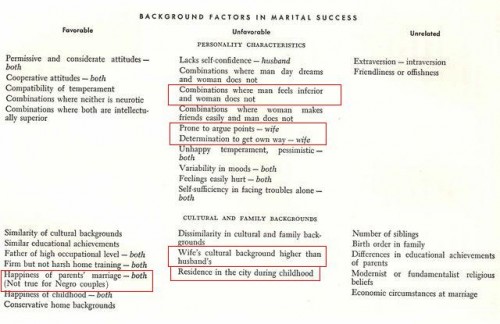
Here we have a list of some factors that are favorable, unfavorable, or unimportant for marital success; I’ve circled some of the more noteworthy items in red:

book 5

Text I highlighted:

[favorable]

Happiness of parents’ marriage —both (Not true for Negro couples)

[unfavorable]

Combinations where man feels inferior and woman does not

Prone to argue points–wife

Determination to get own way–wife

Wife’s cultural background higher than husband’s

Residence in the city during childhood

So you’re sure to have marital problems if the wife won’t give in on things and instead keeps being all argumentative and wanting her own way. I’m not sure what defines a cultural background as “higher” than others, but we see here the same pattern as we do with social class (which I presume is related to cultural background): it’s ok for men to “marry down,” but women aren’t supposed to.

The textbook provides a pretty grim depiction of sex for a newly-married couple:

sex

I found this little gem in on a page from the section on how ideals of marital life often don’t fit with reality:

ads

It’s so widespread to think of marketing and advertising as manipulative today (even among those who like at least some ads or don’t see a real problem with them) that it’s striking to see such a sincerely  positive portrayal of it as a helpful, even “kind” industry.

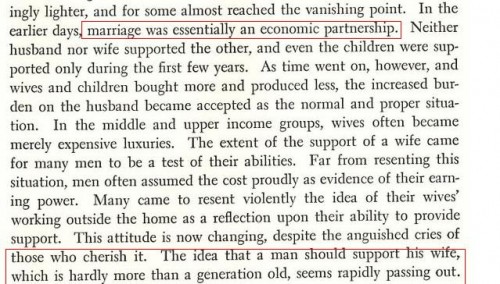
It is noteworthy that the textbook, used during the height of the “Leave it to Beaver” “traditional” family era, depicts the male-breadwinner/female-homemaker family form as a recent creation, as wives became “expensive luxuries”:

money

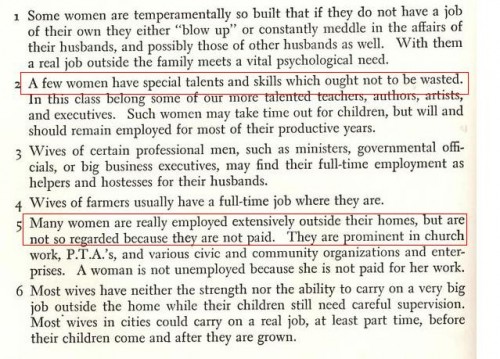
This section describing which women should work doesn’t seem to speak highly of women overall, since just a “few” of us have “special talents and skills.” However, it does make the point (in #5) that “a woman is not unemployed because she is not paid for her work,” an effort to bring attention to the value of women’s unpaid labor (in this instance, community/volunteer work):

skills

And then there is a helpful discussion of eugenics and good breeding :

book 10

book 11

There’s a lot to ponder there. I think it’s fascinating the way that it illustrates some of our stereotypes about the 1950s/60s (women are supposed to be mothers, sex outside of marriage is bad, etc.) but contradicts others (the male-breadwinner family isn’t a long-standing “traditional” family but rather one they can clearly trace to the recent past, and which even then seemed like it might not last).

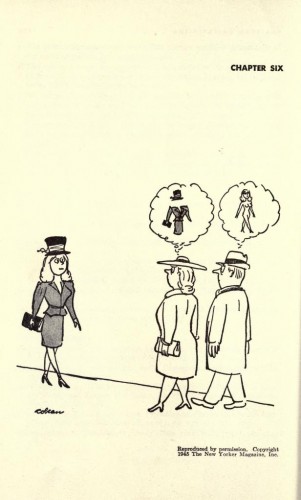
UDPATE: Larry looked through the pdf version of the whole book and found this nice cartoon:

when_to_marry_cartoon

Jessica H. S. sent in this photo:

4002407705_1ab27d71e0_o

Not that there is anything wrong with any of these games or careers, per se. It’s just the constant reinforcement of these gendered ideas of appropriate roles/careers/interests that is disheartening. Many of these games focus on roles that emphasize appearances, whether of people or homes; otherwise, you can care for children.

Though I will say, Peggle is awesome. I eventually had to delete it from my laptop for the sake of ever accomplishing anything again.

Ryan A. sent in this image of a letter (found at Letters of Note) sent to the Postmaster General in 1934, in which men ask for women to be fired so that men can have jobs:

4013497117_be9b6c7448_o

Notice that work is depicted as an oppressive burden for women (“…in place of making slaves of them let them be ladies”). Men, on the other hand, are entitled to take employment from women if they are in need of it to avoid being “bums” (and apparently it’s ok to make slaves of them).

Now, don’t get me wrong: I actually have sympathy for the psychological distress these and other men must have felt at the time. When manhood is highly associated with the ability to support a family on your income alone, job loss and poverty is not just embarrassing, it is a threat to your very identity as a man. The plea for jobs to help young men “make a name for themselves” is partly a call to let them become responsible adult men in good social standing, rather than bums (a term loaded with moral judgment).

So I have sympathy for the men struggling with the feeling of failure that came with joblessness. But it’s still noteworthy that the letter indicates a sense of entitlement to women’s jobs (much like veterans returning from World War II felt toward women who had taken jobs outside the home). Women, presumably, had a husband to support them and it was his duty to not be a bum so that she wouldn’t need to take a job from another man.

A gallery at Time Magazine offered a set of photographs that counter the frequent representations of Saudi women as (veiled) and downtrodden.  The slide show features professional women at work.

Daneh Abuahmed, Rotana’s head of information technology:

saudi_12

Dr. Maha Al Muneef, Executive Director of the National Family Safety Program:

saudi_19

Sultana al Rowaili, the head of human resources at Rotana:

saudi_14

Members of the National Family Safety Program:

saudi_2

Norah Al Malhooq, administrator King Faisal Specialist Hospital and Research Centre:

saudi_24

—————————

Lisa Wade is a professor of sociology at Occidental College. You can follow her on Twitter and Facebook.

This Associated Press interactive graphic (via) displays the number of uninsured by state and provides state-specific details on the rise of health insurance costs (for employers and employees) for each state.  The number of uninsured (darker = larger #s; note that this data is highly tied to the number of residents in each state):

Capture

Some data for Illinois:

Capture2

To interpret:  In Illinois, the amount of money an employer pays each year, on average, for a family has increased 65.3% over the last ten years, and the amount the employee pays has increased 88.4%.  Employees with families now spend, on average, $2,743 a year for their health insurance.  That translates into 7% of the family income (assuming a single breadwinner), up from 4% in 1996.  Over a million workers in Illinois are not so lucky; they have no health insurance at all.

This data reminds us that, in addition to many uninsured, many of us are already paying for health insurance, so the use of taxes to pay for government provided health care would not necessarily cost those who are already insured and may actually save them money.

—————————

Lisa Wade is a professor of sociology at Occidental College. You can follow her on Twitter and Facebook.