race/ethnicity: Latinos

Dmitriy T.M. and Jeff H. sent in a link to Mapping the Measure of America, a website by the Social Science Research Council that provides an amazing amount of information about various measures of economic/human development in the U.S. Here’s a map showing median personal (not household) earnings in 2009:

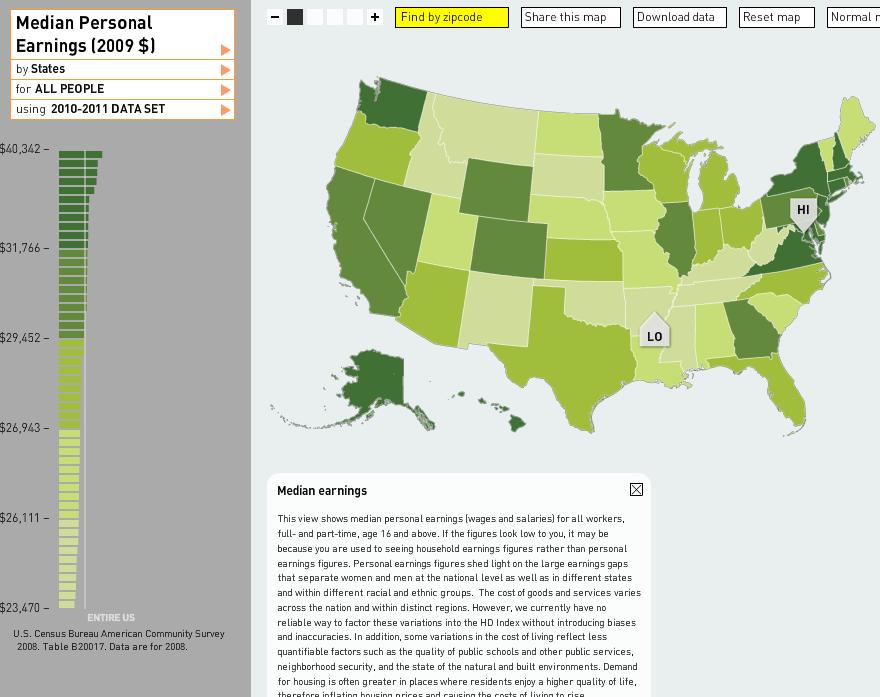
The District of Columbia has the highest, at $40,342; the lowest is Arkansas, at $23,470 (if you go to their website, you can scroll over the bars on the left and it will list each state and its median income, or you can hover over a state).

You can break the data down by race and sex as well. Here’s median personal income for Native American women, specifically (apparently there is only sufficient data to report for a few states):

Native American women’s highest median income, in Washington ($22,181), is  lower than the overall median income in Arkansas, which is the lowest in the U.S. as we saw above.

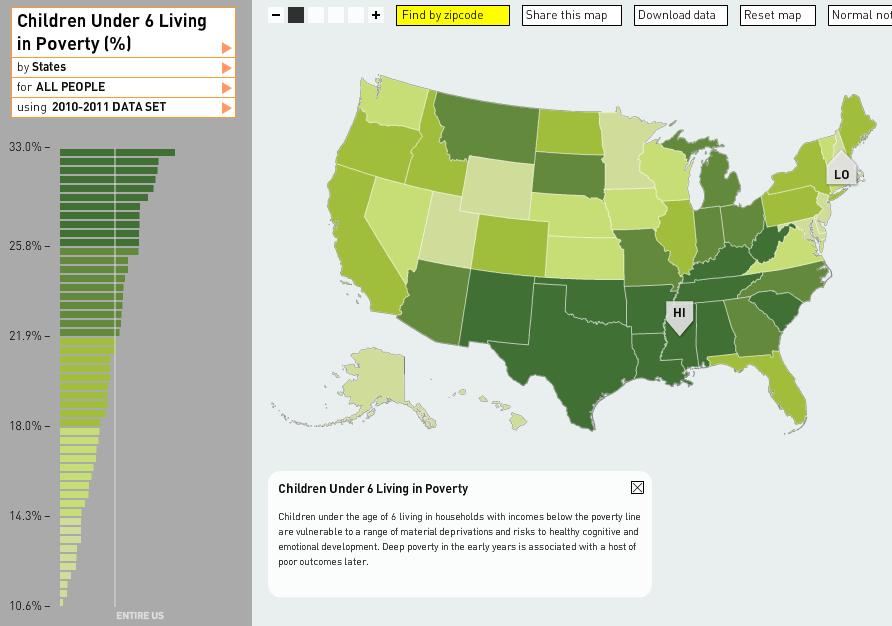
Here is the percent of children under age 6 who live below the poverty line (for all races):

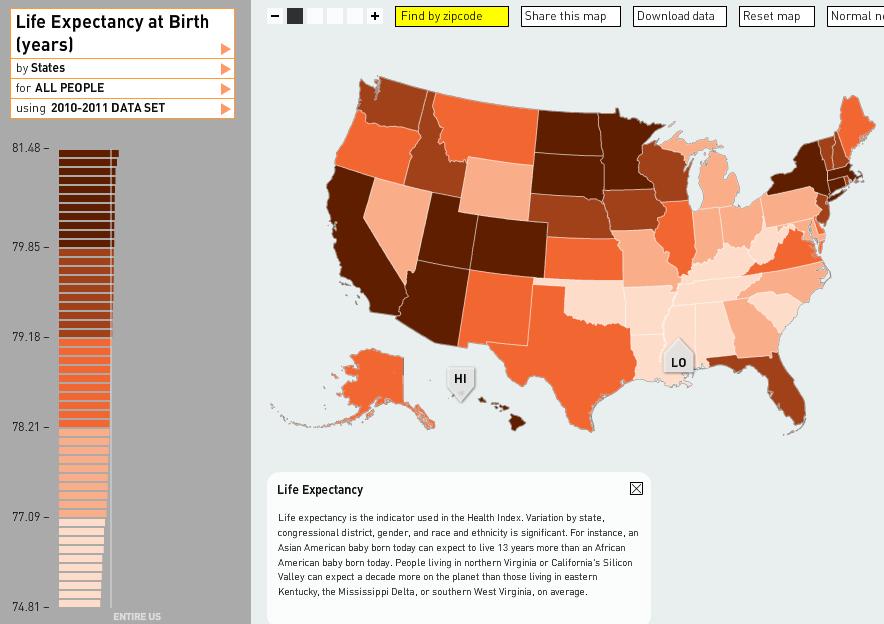
Life expectancy at birth differs by nearly 7 years between the lowest — 74.81 years in Mississippi — to the highest — 81.48 years in Hawaii:

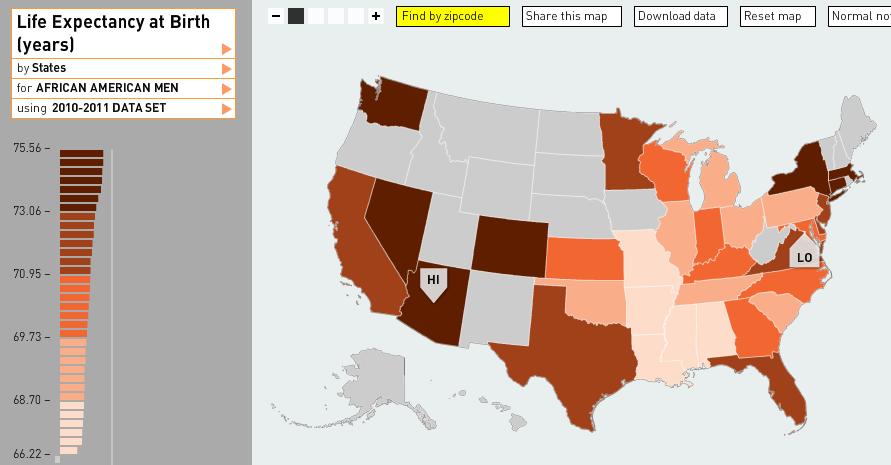
It’s significantly lower for African American men, however, with a life expectancy of only 66.22 years in D.C. (again, several states had insufficient data):

The site has more information than I could ever fully discuss here (including crime rates, various health indicators, all types of educational attainment measures, commuting time, political participation, sex of elected officials, environmental pollutants, and on and on), and it’s fairly addictive searching different topics, looking data up by zip code to get an overview of a particular area, and so on. Have fun!

Enjoy Jennifer Lee, professor of sociology at UC Irvine, discussing how the American concept of race has been changing as we’re confronted with a more complex racial landscape. Are we forcing all racial groups into the pre-existing black/white binary?  A white/non-white binary?  A black/non-black binary?  Or something else?

Lisa Wade, PhD is an Associate Professor at Tulane University. She is the author of American Hookup, a book about college sexual culture; a textbook about gender; and a forthcoming introductory text: Terrible Magnificent Sociology. You can follow her on Twitter and Instagram.


In this 11-minute video, Dalton Conley interviews Victor Rios about the youth control complex.  He argues the that punishing arm of the state (the prison system) and the nurturing arm of the state (the education system) work together to criminalize, stigmatize, and punish young inner city boys and men.

Rios’ ideas apply very well to the treatment of Latarian Milton, the 7-year-old boy who was charged with grand theft auto for taking his grandmother’s car for a joy ride.

Lisa Wade, PhD is an Associate Professor at Tulane University. She is the author of American Hookup, a book about college sexual culture; a textbook about gender; and a forthcoming introductory text: Terrible Magnificent Sociology. You can follow her on Twitter and Instagram.

Dolores R. sent us a photo from Olvera St. in downtown Los Angeles. Olvera Street is a historic site/tourist attraction that commemorates a pueblo founded in 1781.  Some call it the birthplace of Los Angeles.

The photo is of a sign pleading with visitors to behave.  It is written in both Spanish and English but, as Dolores observes, the message in each language is slightly different (translation below).

Dolores explains:

Translation is mostly the same, with the exception of the part regarding the plants. The English says, “Do not touch plants.”

The Spanish version says (literal translation), “Abstain from touching anything, cutting or etching names in the cactus.”

Thoughts?

See also our post documenting differences in the English and Spanish versions of a Kaiser pamphlet for new moms (hint: only one of them emphasizes sterilization).

Lisa Wade, PhD is an Associate Professor at Tulane University. She is the author of American Hookup, a book about college sexual culture; a textbook about gender; and a forthcoming introductory text: Terrible Magnificent Sociology. You can follow her on Twitter and Instagram.

Dmitriy T.M. sent in a link to an interesting breakdown of the race/ethnicity and gender of guests on a number of late-night talk shows, found at Edlundart.

Edlund explains the methodology:

The data for this graphic was gathered over 6 weeks in August and September of 2010. Numbers are based on guest lists as presented on Late Night Lineups. Determining race/ethnicity can be a rather dicey and imprecise activity, and it’s also worth noting that the relationship between census and guest numbers is not a pure one – for example, some of the guests I counted as white are British white people who are visiting the United States.

Of course, a few guests were neither White, Hispanic, Black, nor Asian. These guests were left out, as their numbers were insignificant on the whole…

Edlund also points out that since The Daily Show only has one guest per night, it has a much smaller dataset than the others, so the lack of diversity may be somewhat overstated due to such a small sample.

Here are the results for race (presented as % of all guests); the small dots show the percent in the Census, the wider bars the percent on the show:

Here is the same data but for the top-billed guests only, where the over-representation of Whites goes up even more for most of the shows:

Here’s equivalent data for women:

And, again, for just top-billed guests:

As Edlund says, these data both reflect and reinforce broader cultural patterns. Given that Whites still dominate the political system, for instance, it’s not surprising that political guests would be disproportionately White; and if more movies have male stars than female stars, guest spots will reflect that as well. But at the same time, these shows include people from a range of industries/careers, and their selection of guests helps raise the profile of some individuals more than others, potentially contributing to more opportunities and star power for them. So they don’t just reflect existing realities; they amplify them.

It would be great to get more info on how an individual is selected when there are multiple possibilities — say, you have a movie with several prominent cast members. In that case, are there patterns related to race/ethnicity and gender in which person is most likely to get booked?

According to a story on NPR, Asian Americans are less likely to be unemployed than White, Black, and Hispanic Americans.  But, when they do lose a job, they remain unemployed significantly longer.

Jobless Rates by Race:

Length of Unemployment:

Why might Asians have a more difficult time finding work?  Kent Wong of  UCLA’s Center for Labor Research and Education explains that their extended length of unemployment can be attributed to a confluence of two realities that make their situation unique.  First,about 70% of Asian Americans are foreign born and these immigrants often live in ethnic enclaves (e.g., Chinatowns) that focus on a single industry.  So long as there is work in that industry, Asians can find work.  But, if that industry goes south, their limited network outside of those enclaves becomes a hindrance.  Meanwhile, Asians (unlike Whites, Hispanics, and Blacks) tend to be segregated by language.  Wong explains that, with about a dozen languages spoken widely in the Asian American community, pan-ethnic networks can be difficult to build and maintain.  This leads to extra difficulty finding a new job:

If you have a Vietnamese employee working for a Vietnamese employer in Little Saigon in Orange County, that does not transfer to an ability to get a job in Koreatown in Los Angeles…

Both residential and linguistic segregation, then, contribute to long periods of unemployment for Asian Americans.

Lisa Wade, PhD is an Associate Professor at Tulane University. She is the author of American Hookup, a book about college sexual culture; a textbook about gender; and a forthcoming introductory text: Terrible Magnificent Sociology. You can follow her on Twitter and Instagram.

George H.W. Bush’s 1988 “Willie Horton” campaign ad is infamous for racializing fears of crime, encouraging stereotypes of African American men as violent and threatening. The ad is widely believed to have destroyed Michael Dukakis’s chances for winning the presidency, presenting him as soft on crime. It’s a classic example of race-baiting in political campaigns — ads that present racial/ethnic minorities as threatening. Jesse Helms took a different approach with his affirmative action ad, which draws on some Whites’ fears that they are losing out on jobs because of affirmative action.

This election cycle, a number of candidates have produced ads that clearly attempt to stoke and benefit from anti-Hispanic immigrant sentiment. Talking Points Memo posted a mailer sent out by the Yuma County, Arizona, Republican Party as part of its campaign against Democratic state Representative Rae Waters. One side shows a stop sign full of bullet holes and makes a link between immigrants and neighborhood crime:

SB 1070 is the controversial Arizona law that allows law enforcement officials to check the immigration status of people they have stopped for other violations if there is a “reasonable suspicion” they might be undocumented or not carrying the appropriate papers.

To drive the message home, the other side of the mailer contains an image of a blond child, looking a little disturbed, and again links opposition to SB 1070 to “drugs and violence”:

Here in Nevada, Senate candidate Sharon Angle is currently running this commercial that calls Harry Reid the best friend of “illegals,” who are “putting Americans’ safety and jobs at risk.”

The commercial ends with this image:

She has a second commercial that plays on the same themes:

In West Virginia, this ad against Nick Rahall, a Christian Lebanese-American, prominently displays the phrase “Arab Americans” (he chaired Arab Americans for Obama) while scary music plays in the background:

If you have other examples of racialized or anti-immigrant imagery in current campaign ads, let us know.

UPDATE: S. Elle let us know about this ad by Senator David Vitter, of Louisiana, which is very similar to the Angle commercials:

And kantmakm provided a link to this billboard outside Grand Junction, Colorado:

Rachel F. sent in a link to a site sponsored by the National Center for Culturally Responsive Educational Systems that provides a lot of information on rates of children diagnosed as in need of special education services, broken down by race. For instance, this map shows the proportion of African-Americans aged 6-21 who qualified for special ed services in 2006-2007 for all disabilities (you can also select a specific disability). The states are arranged into quintiles (so each color includes 20% of the states):

I always prefer to know the exact percentages, so I clicked on the Tables tab at the top of the page and looked at the Special Education Rates by Race and Disability link. Here are the percentages for the map above (just the first page of the table):

Here’s the equivalent data for Whites (again, page 1 of the table):

The site also provides info on teacher certification (look under the Tables tab). Here’s page 1 of a table of the states ranked by the % of special-ed teachers who are not fully certified in special education:

If you go to the map and click on a state, you can get the trend in certification over time. This shows special ed teachers who aren’t fully certified in California:

Of course, there are all sorts of interesting questions about special ed that this data set doesn’t address. The evidence is pretty clear that boys are more likely to be diagnosed as having a learning disability than girls are, and some critics suggest that behavioral issues like acting up and causing teachers headaches are becoming the basis of a diagnosis that can have life-long consequences for teachers’, parents’ and students’ expectations about how they’ll do in school. Insofar as perceptions of behavior are affected by a student’s race (see Ann Ferguson’s Bad Boys: Public Schools in the Making of Black Masculinity), this could have particularly negative consequences for some groups.

Interpreting rates of use of special ed programs is hard, too. Does the fact that Black kids in Iowa have much higher rates of qualifying for special ed courses than Black kids in Mississippi do mean that there are more disabilities in Iowa? Or that kids there benefit from better screening to identify kids who might benefit from the classes?

Aside from that, thoughts on what might be causing the dramatic differences in rates between states and between race/ethnicities?