race/ethnicity: Latinos

Last week I went to see the last Harry Potter movie. I was a bit startled that the pre-movie commercials included this ad (thanks to Melissa H.-J., Tom Megginson, and carlafrantastic for the link!):

I was startled both because I hadn’t expected a Summer’s Eve ad at a Harry Potter showing (the 14-year-old boy I had taken with me seemed to desperately wish he could disapparate on out of there) and by the idea that the most powerful thing in the entire world is women’s vaginas — or, as Melissa points out, men’s desperate desire to get access to them through violence toward one another, with women passively waiting around to see who wins so they know who to have sex with.

And as Tom (who blogs at Work that Matters) says, if someone is going to show their vagina “a little love,” perhaps they would best do so by avoiding irritating, unnecessary products that can actually exacerbate problems like yeast infections.

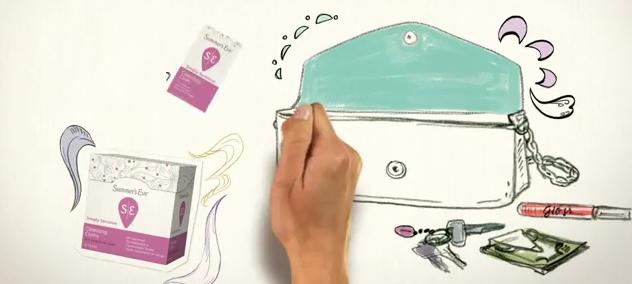
Summer’s Eve also released several more “Hail to the V” ads (all posted at Gawker), sent in by Leila R., Jamie D., Joel T., YetAnotherGirl, Maeghan D., and Finette. The ads inform women that they need to carry wipes for their genitals with them at all times, because you need to clean yourself down there multiple times a day to avoid being gross; Summer’s Eve helpfully created ads targeting different ethnic groups to be sure everyone understands how important this issue is:

Here’s the African-American version:
[Video removed]
This Latina version:
[Video removed]
And the White version:
[Video removed]
Vertical smile? Are they serious with this? And as Finette says, “They’ve managed to combine ‘less than fresh down there’ vagina-shaming [omg, what subtle hints has your vagina been trying to get your attention with?!] with ethnic stereotypes! Awesome!”

UPDATE: After a lot of criticism, Summer’s Eve has pulled the ads and seems to have gotten them removed from YouTube, so none of the videos we initially posted are available any more. However, Laura S. found a clip from TYT Network discussing the ad campaign, so you can get an idea of what they were like. Thanks, Laura!

Rising Immigration and Intermarriage

Today we see both increased immigration and rising rates of intermarriage. In 1960, less than 1% of U.S. marriages were interracial, but by 2008, this figure rose to 7.6%, meaning that 1 out of every 13 U.S. marriages was interracial. If we look at only new marriages that took place in 2008, the figure rises to 14.6%, translating to 1 out of every 7 American marriages.

The rising trend in intermarriage has resulted in a growing multiracial population. In 2010, 2.9% of Americans identified as multiracial. Demographers project that the multiracial population will continue to grow so that by 2050, 1 in 5 Americans could claim a multiracial background, and by 2100, the ratio could soar to 1 in three.

At first glance, these trends appear to signal that we’re moving into a “post-racial” era, in which race is declining in significance for all Americans. However, if we take a closer look at these trends, we find that they mask vast inter-group differences.

For instance, Asians and Latinos intermarry at much higher rates than blacks. About 30% of Asian and Latino marriages are interracial, but the corresponding figure for blacks is only 17%. However, if we include only U.S.-born Asians and Latinos, we find that intermarriage rates are much higher. Nearly, three-quarters (72%) of married, U.S.-born Asians, and over half (52%) of U.S.-born Latinos are interracially married, and most often, the intermarriage is with a white partner. While the intermarriage rate for blacks has risen steadily in the past five decades, it is still far below that of Asians and Latinos, especially those born in the United States.

The pattern of multiracial identification is similar to that of intermarriage: Asians and Latinos report much higher rates of multiracial identification than blacks. In 2010, 15% of Asians and 12% of Latinos reported a multiracial identification. The corresponding figure for blacks is only 7 percent. Although the rate of multiracial reporting among blacks has risen since 2000, it increased from a very small base of only 4.2 percent.

The U.S. Census estimates that about 75-90% of black Americans are ancestrally multiracial, so it is perplexing that only 7% choose to identify as such. Clearly, genealogy alone does not dictate racial identification. Given that the “one-drop rule” of hypodescent* is no longer legally codified, why does the rate of multiracial reporting among blacks remain relatively low?

Patterns in Racial/Ethnic Identity

These are some of the vexing questions that we tackle in our book, The Diversity Paradox, drawing on analyses of 2000 Census data, 2007-2008 American Community Survey, as well as 82 in-depth interviews: 46 with multiracial adults and 36 with interracial couples with children.

Turning to the in-depth interviews with the interracial couples, we found that while all acknowledged their children’s multiracial or multiethnic backgrounds, the meaning of multiraciality differs remarkably for the children of Asian-white and Latino-white couples on the one hand, and the children of black-white couples on the other. For the Asian-white and Latino-white couples, they may go to great lengths to maintain distinctive elements of their Asian or Latino ethnic and cultural backgrounds, but they believe that as their children grow up, they will simply identify, and be identified as “American” or as “white,” using these terms interchangeably, and consequently conflating a national origin identity with a racial identity.

The Asian-white and Latino-white respondents also revealed that they can turn their ethnicities on and off whenever they choose, and, importantly, their choices are not contested by others. Our interview data reveal that the Asian and Latino ethnicities for multiracial Americans are what Herbert Gans and Mary Waters would describe as “symbolic”—meaning that they are voluntary, optional, and costless, as European ethnicity is for white Americans.

By contrast, none of the black-white couples identified their children as just white or American, nor did they claim that their children identify as such. While these couples recognize and celebrate the racial mixture of their children’s backgrounds, they unequivocally identify their children as black. When we asked why, they pointed out that nobody would take them seriously if they tried to identify their children as white, reflecting the constraints that black interracial couples feel when identifying their children. Moreover, black interracial couples do not identify their children as simply “American” because as native-born Americans, they feel that American is an implicit part of their identity.

The legacy of the one-drop-rule remains culturally intact, explaining why 75-90% of black Americans are ancestrally multiracial, yet only 7% choose to identify as such. It also explains why we, as Americans, are so attuned to identifying black ancestry in a way that we are not similarly attuned to identifying and constraining Asian and Latino ancestries.

On this note, it is also critical to underscore that a black racial identification also reflects agency and choice on the part of interracial couples and multiracial blacks. Given the legacy behind the one-drop rule and the meaning and consequences behind the historical practice of “passing as white,” choosing to identify one’s children as white may not only signify a rejection of the black community, but also a desire to be accepted by a group that has legally excluded and oppressed them in the past, a point underscored by Randall Kennedy.

Black Exceptionalism

But regardless of choice or constraint, the patterns of intermarriage and multiracial identification point to a pattern of “black exceptionalism.” Why does black exceptionalism persist, even amidst the country’s new racial/ethnic diversity? It persists because the legacy of slavery and the legacy of immigration are two competing yet strangely symbiotic legacies on which the United States was founded. If immigration represents the optimistic side of the country’s past and future, slavery and its aftermath is an indelible stain in our nation’s collective memory. The desire to overlook the legacy and slavery becomes a reason to reinforce the country’s immigrant origins.

That Asians and Latinos are largely immigrants (or the children of immigrants) means that their understanding of race and the color line are born out of an entirely different experience and narrative than that of African Americans. Hence, despite the increased diversity, race is not declining in significance, and we are far from a “post-racial” society. That we continue to find a pattern of black exceptionalism—even amidst the country’s new racial/ethnic diversity—points to the paradox of diversity in the 21st century.

——————-

* The one-drop rule was first implemented during the era of slavery so that any children born to a white male slaver owner and a black female slave would be legally identified as black, and, as a result, have no rights to property and other wealth holdings of their white father.

———————

Jennifer Lee is a sociologist at the University of California, Irvine, specializing in intersection of immigration and race and ethnicity. She wrote, with Frank Bean, a book called The Diversity Paradox, that examines patterns of intermarriage and multiracial identification among Asians, Latinos, and African Americans.  Lee wrote the following analysis of her research for Russell Sage. And we’re happy to post it here.

Earlier this month, The New York Times and Foreign Policy both reported on the United Nations population forecast for the next 100 years. According to the report, rather than hitting 9 billion at mid-century and then leveling off, the world’s population is likely to climb to 10 million and keep going. The cause: a fertility boom in the global south –– Africa, Asia, Latin America. Such growth, according to the report, if unchecked, will have dire consequences on a world already facing shortages of food, available water and other life-giving resources.

In reporting the story, both the Times and Foreign Policy used pictures of women and their children, but the way they used the pictures was somewhat chilling. For example, the Times ran a photo of several women of color under the heading: “Coming to a Planet Near You: 3 Billion More Mouths to Feed.”

Additionally, Foreign Policy ran a photo under the sub-headline: “Why ignoring family planning overseas was the worst foreign-policy mistake of the century.” It featured a picture of dark-skinned women with a child.

These photos, paired with the headlines and the dire predictions in the stories of what’s to come should the global south’s fertility boom remain unchecked, tap into anxieties about women’s bodies and link the coming doom and gloom directly to them. The Times headline, warning of “3 billion more mouths to feed,” is combined with seven new mothers in Manila; positioned in a long row, they crowd the frame of the photograph as they are imagined to crowd the planet.  While the Foreign Policy sub-headline inspires fear, saying that allowing the burgeoning birth rate was  the “worst… mistake of the century.”  Its photo features two women and a child in the foreground.  In both cases the focus on women makes it seem as if men have no role in reproduction at all.

Whether they meant it or not, such a juxtaposition does little more than demonize women –– particularly poor women from developing countries –– as directly responsible for the problem of overpopulation and its solution. While the commentaries herald funding for family planning and education –- both great ideas –– they contain no conversation about economic systems that create or maintain poverty in certain parts of the world; how patriarchy and systems of male-centered power prevent women from being able to control their own reproduction; and how international development money too often comes with strings attached that restrict government resources for education and health care, especially for women, who too often are the ones who bear the hardest brunt of poverty and the greatest social opprobrium.

Here’s what an alternative might look like:  GOOD Magazine discussed the U.N. report and the coming population boom. Its focus: How responsible living in the United States and other wealthy countries can help ensure food for all. The photo that ran with the commentary: a photo of the planet Earth.

Barbara Yuki Schwartz is a doctoral student in the Theology, History and Ethics program at Garrett-Evangelical Theological Seminary in Evanston, Ill.  She studies postcolonial and poststruturalist theory, political theory and theology, trauma studies, and is interested in how body, community and psychic life intersect and influence theology and liturgy. She blogs regularly at Dialogic Magazine.

Elyse Mc.D. sent in this graphic based on data from the Stanford Center for the Study of Poverty and Inequality that summarizes a number of aspects of inequality.

You can get a larger version here. I took screencaps of three of the figures I found most striking:

Via.

Sonita M. sent in a link to an image at GOOD that shows the makeup of the U.S. Senate and House of Representatives now in terms of various characteristics (race/ethnicity, gender, political party, religion) and what it would look like if its members were more demographically representative of the U.S. population as a whole:

As they point out in the accompanying article, however, the area where Congress most differs from the U.S. population as a whole is in terms of socioeconomic status. The average wealth of members of Congress, according to OpenSecrets.org (they don’t specify if it’s the mean or the median, so I presume it’s the mean):

For the U.S. as a whole, median wealth was $96,000 in 2009 (the mean was $481,000), according to the Federal Reserve (via CNNMoney).

Today marks what would have been César Chávez’s 84th birthday.  Chávez was born in 1927 to Mexican American farmers in Arizona.   Here he is, right, at age six with his sister:

When he was about 11, his family lost their farm in the Great Depression and they turned to migrant farm work.   In 1962 he and Dolores Huerta founded the National Farm Workers Association (later the United Farm Workers).  His success in organizing farm workers, raising awareness of the conditions of their work, and raising support for their cause is one of the most inspiring stories of collective action in American history.  Read more about Chávez here.


Lisa Wade, PhD is an Associate Professor at Tulane University. She is the author of American Hookup, a book about college sexual culture; a textbook about gender; and a forthcoming introductory text: Terrible Magnificent Sociology. You can follow her on Twitter and Instagram.

I’m still totally geeking out about the Census Bureau starting to release data from the 2010 Census, so today you’re getting another post based on it. Kristina K. let us know that Salon has up maps of the 10 most racially-segregated metropolitan areas with populations of 500,000+, based on analyses from the University of Michigan’s Population Studies Center and available at CensusScope. Note that in the race categories, Hispanic is presented as a separate category; all other racial groups include only members of that race who said they were not of Hispanic origin. The Population Studies Center also has data available broken down by specific races and at the state level, though they don’t have maps for them, just the raw dissimilarity indices.

Here’s L.A., at #10:

Here, just for my friend Tony, is his hometown of Buffalo, NY, #6 on the list:

New York comes in second:

The most segregated 500,000+ metro area in the U.S.? Milwaukee:

Based on the dissimilarity index, over 81% of Milwaukee’s non-White population would have to relocate to be distributed similarly to Whites.

Interestingly, given assumptions many have about race relations in the U.S., the South doesn’t show up here. St. Louis is the most Southern city in the top 10, which is dominated by cities in the old industrial core of the North and upper Midwest/Great Lakes regions.

The U.S. Census Bureau has started releasing data from the 2010 Census. This map shows the change in the racial/ethnic minority (i.e., anything other than non-Hispanic White) population over the last decade:

Legend:

They released a report, An Overview: Race and Hispanic Origin in the 2010 Census (available here), which includes data on those who reported more than one race. Among those who reported more than one race, the vast majority listed two. Here are the most commonly reported combinations:

AIAN = American Indian/Alaska Native, NHPI = Native Hawaiian/Pacific Islander, and SOR = some other race.

Laura E. pointed out that New Geography posted some maps based on 2010 Census data. Here’s the Hispanic population as a percent of the total population, by county (notice that the legend need to be multiplied by 100 to get the percent):

The African American population (alone or in combination with another race, and again, multiply by 100):