politics

Cross-posted at Reports from the Economic Front.

While newspapers give a lot of ink to arguments about whether reducing the budget deficit will boost or reduce growth, they seem to have little interest in the related issue of whether economic growth really benefits the great majority.

David Cay Johnston, the Pulitzer Prize winning financial journalist, recently addressed this issue drawing on the work of economists Emmanuel Saez and Thomas Piketty:

In 2011 entry into the top 10 percent… required an adjusted gross income of at least $110,651. The top 1 percent started at $366,623.

The top 1 percent enjoyed 81 percent of all the increased income since 2009. Just over half of the gains went to the top one-tenth of 1 percent, and 39 percent of the gains went to the top 1 percent of the top 1 percent.

Ponder that last fact for a moment — the top 1 percent of the top 1 percent, those making at least $7.97 million in 2011, enjoyed 39 percent of all the income gains in America.

So, 81 percent of all the new income generated from 2009 to 2011 was captured by the top 1 percent income earners, where income is defined as adjusted gross income, which refers to income minus deductions or taxable income.  In other words, growth, even accelerated growth, is not going to do the majority much good if the economic structure remains the same.

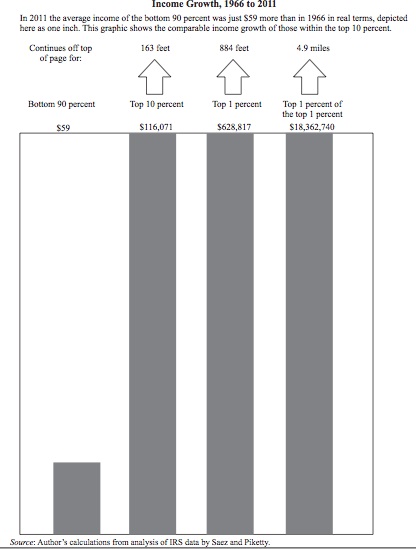
Johnston highlights the problem with our existing economic model with perhaps an even more shocking example.  He compares the average income growth of the bottom 90 percent with the average income growth of the top 10 percent, 1 percent, and top 1 percent of the top 1 percent over the period 1966 to 2011.

It turns out that the average income of the bottom 90 percent rose by a miniscule $59 over the period (as measured in 2011 dollars).  By comparison, the average income of the top 10 percent rose by $116,071, the average income of the top 1 percent rose by $628,817, and the average income of the top 1 percent of the top 1 percent increased by a whopping $18,362,740.  In short, growth alone means little if the great majority of people are structurally excluded from the benefits.

In an effort to highlight this extreme disparity in adjusted income growth rates, Johnston suggests plotting the numbers on a chart, with $59, the amount gained by the bottom 90 percent, represented by a bar one inch high.  As the chart below shows, the bar representing average gains for the top 10 percent would be 163 feet high, that for the top 1 percent would be 884 feet high, and that for the top 1 percent of the top 1 percent would be 4.9 miles high.

1

In sum, the real challenge facing the great majority of Americans is not figuring out how to make the economy growth faster.  Rather, it is figuring out how to create space for a real debate about how to transform our economy so that growth will actually satisfy majority needs.

Martin Hart-Landsberg is a professor of economics at Lewis and Clark College. You can follow him at Reports from the Economic Front.

Cross-posted at Montclair SocioBlog.

Jeb Bush told CPAC that the Republican party had an image problem.

Way too many people believe that Republicans are anti-immigrant, anti-woman, anti-science, anti-gay, anti-worker.

People have good reason to believe those things.  But the “way too many” suggests that the GOP’s problem is not image or brand, it’s demography.  For five years or longer, the Republican faithful have been complaining that “their” country was being taken away from them, and they were going to take it back (e.g., see my “Repo Men” post).

They were right.  Their country, a country dominated by older white men, is fading in the demographic tide.  The groups whose numbers in the electorate are on the rise don’t look like them.  Andrew Gelman (here) recently published these graphs as an update to his 2009 Red State, Blue State.  They reveal the tendency for different groups to vote more Democratic (blue) and Republican (red):

1

(The exit poll the data are based on sampled only in the 30 most competitive state. Texas and Georgia are large, and they have significant non-White populations. But demographic changes there are unlikely to have much effect on which party gets their electoral votes.)

Unfortunately for the GOP, the non-White proportion of the electorate will continue to grow. The female proportion may also increase, especially as education levels of women rise (more educated people are more likely to vote than are the less educated).

The key factor is party loyalty.  And, at least in presidential elections, people do remain loyal. I think I once read, “If you can get them for two consecutive elections, you’ve got them for life.”  Or words to that effect.  If that’s true, the age patterns of the last two elections should be what the Republicans are worrying about.

2

Trying to make themselves more attractive to younger people will not be easy.  Oldsmobile tried it not so long ago (a post on that campaign is here).  “This is not your father’s GOP” might have similar lack of success.  But insisting that this is still your father’s GOP (or more accurately, some white dude’s father’s GOP) seems like a formula for failure.

Jay Livingston is the chair of the Sociology Department at Montclair State University. You can follow him at Montclair SocioBlog or on Twitter.

Cross-posted at Montclair SocioBlog.

You’re not going to persuade a conservative by appealing to liberal moral principles.  Tell a Tea Party type that industrial waste harms the environment and should be regulated, you won’t get very far.  But if you appeal to conservative moral principles, the story goes, you might have more luck.

I’ve been skeptical about Jonathan Haidt’s conservative moral principles — group loyalty, purity, and authority — mostly because they are used to justify practices I find wrong or immoral.  Things like anti-gay legislation, torture, assassination, terrorism, etc.

But a recent experimental study by UC Berkeley’s Robb Willer shows that the right kind of persuasion can make conservatives a bit more leftist on the environment.  In his study, participants read a pro-environmental message that was based either on “Harm/Care” (liberal logic) or on “Purity/Sanctity”(conservative logic) along with photos that matched the appeal.

  • Harm/Care: A destroyed forest of tree stumps, a barren coral reef, and cracked land suffering from drought.
  • Purity/Sanctity: A cloud of pollution looming over a city, a person drinking contaminated water, and a forest covered in garbage.

1

There was also a Neutral condition: “an apolitical message on the history of neckties.” (Willer has a fine sense of humor.)

Participants were then asked questions to determine their support for pro-environmental legislation.

2

For people who identified themselves as liberal, the type of material they saw — Harm, Purity, or Necktie — made no difference in their environmental position.  Conservatives, as expected, were generally cooler to environmental legislation, but only in the Neutral and Harm conditions.  Once they were shown the Purity materials, conservatives were as pro-environment as the liberals.

Other aspects of the conservative mind-set seem to go along with this emphasis on purity:  simplicity rather than complexity and a lower tolerance of ambiguity.  It’s a view that sees the need for clearly marked and rigidly enforced boundaries — the boundaries of the nation, the boundaries of the individual, the boundaries of cognitive categories.

Ultimately, the findings suggest that common ground between liberals and conservatives may not be as impossible to find as it may seem.

Jay Livingston is the chair of the Sociology Department at Montclair State University. You can follow him at Montclair SocioBlog or on Twitter.

The current political discourse is so focused on a single form of government revenue, that the word taxes has become essentially synonymous with just one tax in particular; the federal income tax.  In fact, unless there is a foreign policy crisis, the federal income tax usually dominates most political discussion given how the federal budget (or increasingly the federal debt) relates to almost anything and everything the federal government does (or does not do in more and more instances).

For example, during the closing months of 2012 we watched how a fight over a sunset of the Bush Tax Cuts almost shoved the United States over a fiscal cliff.  Just prior to this near crisis, the most discussed difference between 2012 presidential candidates was their disagreement about a 4 point increase in the highest federal income bracket.  Also, Mitt Romney will likely be remembered mostly for his disparagement and disregard of “The 47% of United States Citizens who pay no federal income tax.”

However, limiting discussion about government funding and spending to just the federal income tax and ignoring the other types of payments we make to the treasury is not without consequence, especially given how the federal income tax is actually a very unique kind of tax.  Unlike excise taxes, payroll deductions, sales taxes and most property taxes that are regressive or require the poor to pay a larger proportion of their resources than the wealthy; the federal income tax is one of the few progressive taxes in the United States because at least on paper (I say that because these marginal rates often do not equate the larger effective rates given that the wealthy are afforded more loopholes, deductions, and lower rates on investment income), the rich pay larger marginal rates than the middle-class and poor.   Thus, with our political discussion largely limited to the federal income tax, it should come as no surprise conservatives are so easily able to frame “The State,” especially the federal government, as a perverse Robin Hood who steals from the rich (the makers as they are being called now) to give to the poor (the takers).

The non-profit, non-partisan Institution on Taxation and Economic Policy recently released its research on the taxes families in the United States paid in 2010.  These findings reveal when the focus is taken off the federal income tax and the entire tax system is examined, cumulative household taxes in nearly every state are regressive because the less money a family makes, the larger proportion they pay to the different levels of government.  As the graph below shows, the cumulative tax system is regressive because sales, excise and property taxes offset progressive income taxes at both the state, and federal levels.

The tax system as a whole is largely regressive because the higher one’s class standing, the lower the proportion of total taxes they pay.  While the report provides great details in the variations across each state, the graph below shows that on average, the lowest 20% of earners pays an overall tax rate that is more than twice of what the top 1% of earners pay.

While many citizens perceive the U.S. tax code as inherently unfair because the wealthy have higher marginal rates on their federal income tax (the only one anyone ever seems to talk about); an examination of the entire system reveals the opposite as cumulatively, the poor pay a larger proportion of their income to local, state, and the federal governments.

—————————

Jason Eastman is an Assistant Professor of Sociology at Coastal Carolina University who researches how culture and identity influence social inequalities.

Last month the New York Post ran with this unflattering cover photo of Hillary Clinton responding strongly to congressional questioning and the tagline “No Wonder Bill’s Afraid.”

The not-so-subtle sexist messages include:

  • Even if you’re secretary of state in the most powerful country in the world, it’s not alright to get angry if you’re a woman;
  • when a powerful woman raises her voice to make a point, she is out of control — “exploding with rage”;
  • and when a man is married to a powerful woman, even a man who used to lead the free world, he is automatically cowed by her.

Despite rapid gains in women’s political and corporate leadership since the 1970s, powerful women are still held to the damaging double-bind of appearing “properly” masculine in order to appear
leaderly and “properly” feminine so as to not violate social expectations.

Caroline Heldman is a professor of politics at Occidental College. You can follow her at her blog and on Twitter and Facebook.

Cross-posted at Montclair SocioBlog.

I’m generally skeptical about claims that names in the media have a big impact on parents’ choices of what to name the baby (see this earlier post on “Twilight” names).  But Hilary Parker points out some examples where celebrity influence is unmistakable.  Like Farrah.

“Charlie’s Angels” came to TV in 1976, and the angel prima inter pares was Farrah Fawcett.  This poster was seemingly everywhere (and in 1976, that barely noticeable nipple was a big deal):

But as with most names that rise quickly, Farrah went quickly out of style.  If you see a Farrah on a dating site listing her age as 29, she’s lying by six or seven years.

Hilary is different.  The name grew gradually in popularity, probably flowing down through the social class system.  There was no sudden burst of popularity caused by the outside force of a celebrity name (see Gabriel Rossman’s post on endogenous and exogenous influences).  Then in 1992, Hilary seemed to have been totally banned from the obstetrics ward.

Surely, the effect came not from word of mouth but from a prominent Hilary (or in this case, the rarer spelling Hillary), the one who said she wasn’t going to stay home and bake cookies.

Maybe now that Hillary is getting a favorable press — good reviews for her stint as Secretary of State — the name might return to its 1980s popularity.

Jay Livingston is the chair of the Sociology Department at Montclair State University. You can follow him at Montclair SocioBlog or on Twitter.

Cross-posted at Reports from the Economic Front.

The British economy is a disaster.  Oddly enough most analysts find it difficult to explain why.

Actually the reason is quite simple. The British government responded to its own Great Recession by cutting spending and raising taxes.  The result, which is anything but mysterious, is that the county remains in deep recession.

Matthew O’Brien, writing in The Atlantic, describes the situation as follows:

…public net investment — things like roads and bridges and schools,  and everything else the economy needs to grow — has fallen by half the past three years, and is set to fall even further the next two. It’s the economic equivalent of shooting yourself in both feet, just in case shooting yourself in one doesn’t completely cripple you. Austerity has driven down Britain’s borrowing costs even further, but that’s been due to investors losing faith in its recovery, rather than having more faith in its public finances. Indeed, weak growth has kept deficits from coming down all that much, despite the higher taxes and slower spending. In other words, it’s economic pain for no fiscal gain.

Below is a chart taken from The Atlantic article.  It shows that:

Britain’s stagnating economy has left it in worse shape at this point of its recovery than it was during the Great Depression. GDP is still more than 3 percent below its 2008 peak, and it hasn’t done anything to catchup in years. At this pace, there will be no recovery in our time, or any other time.

 gdp to december 2012

In other words, while the British economy suffered a deeper decline during the Great Depression period of 1930 to 1934 than to this point in the Great Recession which started in 2008, the economy recovered far more quickly then than now.  In fact, it doesn’t seem to be recovering now at all.

Perhaps the most surprising thing about the situation is that political leaders appear determined to stay the course.

Martin Hart-Landsberg is a professor of economics at Lewis and Clark College. You can follow him at Reports from the Economic Front.

Cross-posted at Montclair Socioblog.

In the New York Times, Arthur Brooks argues that conservatives are happier than liberals.

Brooks starts with a reference to Barack Obama’s remark four years ago  about “bitter” blue-collar Whites who “cling to guns or religion.” Misleading, says Brooks.  So is a large body of research showing conservatives as “authoritarian, dogmatic, intolerant of ambiguity, fearful of threat and loss, low in self-esteem and uncomfortable with complex modes of thinking.”

Despite that research, it’s conservatives, not liberals, who identify themselves as happy.  And, Brooks adds, the farther right you go on the political spectrum, the more happy campers you find.

Brooks cites a couple of surveys that support this view.  I was a bit skeptical, so I went to the GSS.

Sure enough, by about 10 percentage points, more conservatives identify themselves as “very happy” than do liberals.  The difference is even higher among the extreme conservatives.   As Brooks says, “none, it seems, are happier than the Tea Partiers, many of whom cling to guns and faith with great tenacity.”

Brooks cites two important factors linking political views and happiness: marriage (with children) and religion.

Religious participants are nearly twice as likely to say they are very happy about their lives as are secularists (43 percent to 23 percent). The differences don’t depend on education, race, sex or age; the happiness difference exists even when you account for income.*

I still found it hard to reconcile these sunny right-wingers with the image of bitter and angry Tea Partiers.  Then I remembered that the Tea Party is a very recent phenomenon.  To a great extent, it’s a reaction to the election of President Obama.    But Brooks is looking at pre-Obama studies of happiness.  The most recent one he cites is from 2006.  As the GSS graph above shows, Brooks is correct when he says, “This pattern has persisted for decades.”  But those decades don’t include the Tea Party.

Maybe conservatives were happy because until recently, they didn’t have much to be bitter about.  The US was their country, and they knew it.   Then Obama was elected, and ever since November 2008 conservatives have kept talking about “taking back our country.” (See my “Repo Men” post from 2 1/2 years ago.)

What if we look at the data from the Obama years?

Maybe that bitter Tea Party image isn’t such a distortion.  The GSS does not offer “bitter” or “Tea Party”  as choices, but those who identify themselves as “extreme conservative” are nearly three times as likely as others to be “not too happy.”  And overall, the happiness gap between conservatives and liberals is hard to find.

For all I know, Brooks’s general conclusion may be correct, but the recent data do at least raise some questions and suggest that the political context is itself a relevant variable.

Nearly eighty years ago, Harold Lasswell said that politics is about “who gets what, when, and how.”  Maybe the lesson here is that if you are going to study the connection between political views and happiness, you should take account of who is getting what, and when.

*That’s a bit misleading.  Happiness is in fact related to income, race, and education in exactly the ways you would expect, though for some reason Brooks does not include those variables in his analysis.  What Brooks means is that the religion effect holds even when you control for those variables. 

—————————

Jay Livingston is the chair of the Sociology Department at Montclair State University.  You can follow him at Montclair SocioBlog or on Twitter.