politics: election 2016

The 2017 Women’s March was a historic event.  Social media alone gave many of us the notion that something happened on an incredibly grand scale.  But measuring just how “grand” is an inexact science.  Women’s Marches were held around the world in protest of Trump on the day following his inauguration.  Subsequently, lots of folks have tried to find good ways of counting the crowds.  Photos and videos of the crowds at some of the largest marches are truly awe-inspiring.  And the media have gotten stirred up attempting to quantify just how big this march really was.

Think about it.  The image below is taken of some of the crowds in Los Angeles.  The caption Getty Images associates with the image includes the estimate “Hundreds of thousands of protesters…”  But, was it 200,000?  Or was it more like 900,000?  Do you think you could eyeball it and make an educated guess?  We’d bet you’d be off by more than you think.  Previous research has found, for instance, that march participants and organizers are not always the best source of information for how large a protest was.  If you’re there and you’re asked how many people were there, you’re much more likely to exaggerate the number of people who were actually there with you.  And that fact has spawned wildly variable estimates for marches around the U.S. and beyond.

More than one set of estimates exist attempting to figure this out.  The estimates that have garnered the most media attention (deservedly) are those produced by Jeremy Pressman and Erica Chenoweth.  They collected as many estimates as they could for marches all around the world to try to figure out just how large the protest was on a global scale.  Pressman & Chenoweth collected a range of estimates, and in their data set they classify them by source as well as providing the lowest and highest estimates for each of the marches for which they were able to collect data. You can see and interact with those estimates visually below in a map produced by Eric Compas (though some updates were made in the data set after Compas produced the map).

By Pressman & Chenoweth’s estimates, the total number of marchers in the U.S. was between 3,266,829 and 5,246,321 participants.  When they include marches outside the U.S. as well they found that we can add between 266,532 and 357,071 marchers to that number to understand the scale of the protest on an international scale.  That is truly extraordinary.  But, the range is still gigantic.  The difference between their lowest and highest estimate is around 2.1 million people!  Might it be possible to figure out which of these estimates are better estimates of crowd size than others?

Nate Silver at FiveThirtyEight.com tried to figure this out in an interesting way.  They only attempted to answer this question for U.S. marches alone.  And Silver and a collection of his statistical team produced their own data set of U.S. marches.  They collected as many crowd estimates as they could for all of the marches held in the U.S.  And there are lots of holes in their data that Pressman and Chenoweth filled.  March organizers collect information about crowd size and are eager to claim every individual who can be claimed to have been present.  But, local officials estimate crowd sizes as well because it helps to give them a sense of what they will need to prepare for and respond to such crowds.  As a part of this, some marches had estimates from march organizers, news sources, official estimates, as well as estimates from non-partisan experts (so-called crowd scientists)–this is especially true of the larger marches.  Examining their data, they discovered that for every march in which they had both organizer and official estimates, the organizers’ estimate was 50-70% higher than the officials’ estimates.  As Silver wrote: “Or put another way, the estimates produced by organizers probably exaggerated crowd sizes by 40 percent to 100 percent, depending on the city” (here).  The estimates Silver produced at FiveThirtyEight are mapped below.

You can interact with the map to see Nate Silver’s team estimate, but also the various estimates on which that estimate is based.  And you may note that the low and high estimates are often the same for Silver and for Pressman & Chenoweth (though not always).  Additionally, there were a good number of marches in FiveThirtyEight’s data set that lacked any estimates at all. And those marches are not visible on the map above.  Just to consider some of what is missing, you might note that there are no marches on the map immediately above in Puerto Rico, though Silver’s data set includes four marches there–all with no estimates.

Interestingly, Silver took a further step of offering a “best guess” based on patterned differences between types of estimates they found for marches for which they had more than a single source of data (more than one estimate).  For instance, where there were only organizers’ estimates, they discounted that estimate by 40%, assuming that it was exaggerated.  They discounted news estimates by 20% for similar reasons.  Sometimes, non-partisan experts relying on photographs and videos provide estimates were available, which were not discounted (similar to official estimates).

It might be possible then, as Pressman & Chenoweth collected many more estimates, to fine-tune Silver’s formula and possibly come up with an even more accurate estimate of crowd sizes at marches around the world based on the source of the estimate. It’s a fascinating puzzle and a really interesting and simple way of considering how to resolve it with a (likely) conservative measure.

By these (likely conservative) estimates, marches in the U.S. alone drew more than 3,000,000 people across hundreds of separate locations across the nation.  In the U.S. alone, FiveThirtyEight estimated that 3,234,343 people participated (though, as we said, some marches simply lacked any source of data in the data set they produced).  And that number, you might note, is strikingly close to Pressman & Chenoweth’s low estimate for the U.S. (3,266,829).  Even by this conservative estimate, this would qualify the 2017 Women’s March as certainly among the largest mass protests in U.S. history.  It may very well have been the largest mass protest in American history.  And in our book, that’s worth counting.

Tara Leigh Tober, PhD is a Lecturer in the Sociology Department at the University of California, Santa Barbara.  She studies the sociology of memory, is writing a book on how the Irish have remembered being neutral during WWII, and is presently engaged in a study on mass shootings in the U.S.  You can follow her on Twitter here.

Tristan Bridges, PhD is a professor at the University of California, Santa Barbara. He is the co-editor of Exploring Masculinities: Identity, Inequality, Inequality, and Change with C.J. Pascoe and studies gender and sexual identity and inequality. You can follow him on Twitter here. Tristan also blogs regularly at Inequality by (Interior) Design.

Originally posted at the Contexts blog.

Among the many forces contributing to the surprising Trump election was the shift of many White working class voters to vote for the upstart candidate. For years, these working-class families had been hurting; their incomes stagnated, good jobs became hard to find, and their health suffered. More importantly, entire working-class communities declined. It was not just personal economic misfortune, it was a class.

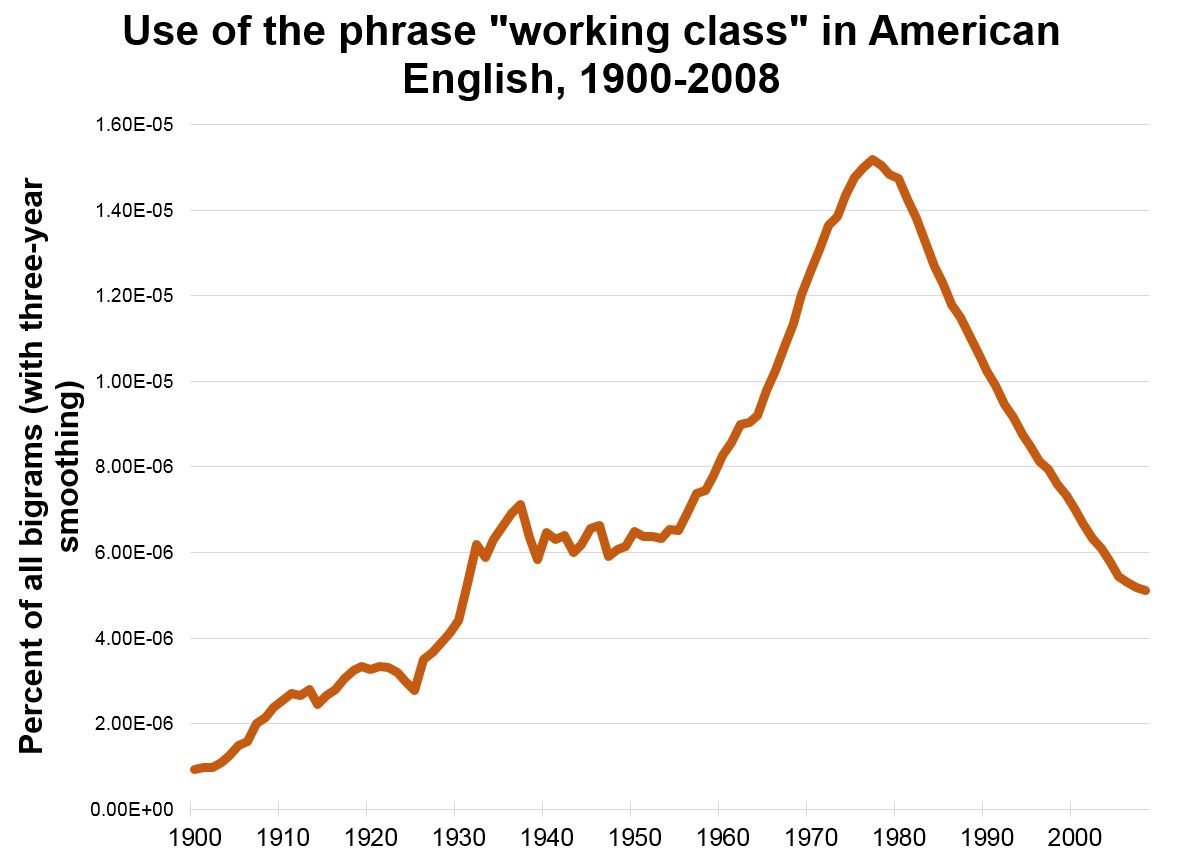
The problems of the White working class were not unknown, but they were not often addressed very directly. Sometimes, the most common advice was they should get more training or send their kids to college – advice that could sound more like a middle-class put-down than a realistic policy addressing their problems. But, for the most part, the working class was just ignored, a neglect that made them ripe for Trump’s appeals. This neglect was a general cultural phenomenon; a Google ngram count of the phrase “working class” in American books shows a spike in the Depression Thirties and an even stronger growth from the mid-1950s to the mid-1970s. But after the mid-1970s, there is a steady decline, implying a lack of discussion just as their problems were growing.  The implicit message seemed to have been that their problems didn’t matter.

vanf1

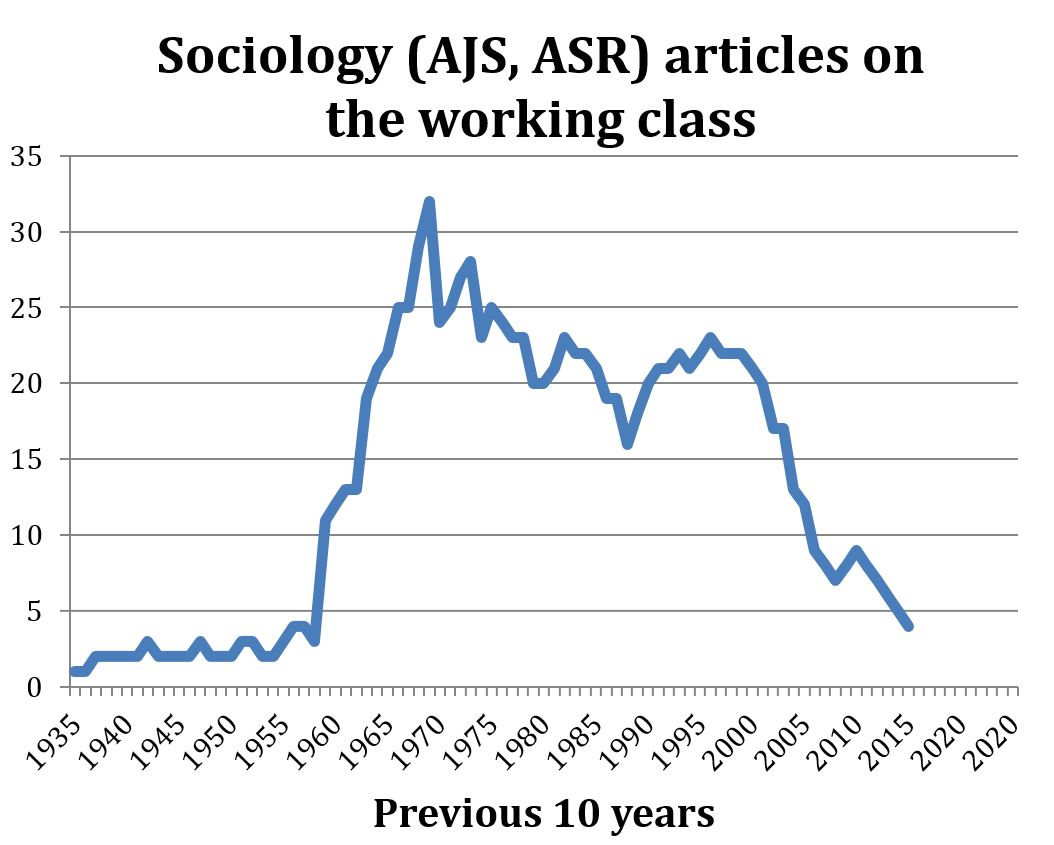
U.S. sociology was not immune from this broader cultural trend. A count of the frequencies of “working class” in the titles or abstracts of articles in the American Journal of Sociology and the American Sociological Review shows a quite similar if even more dramatic pattern: rapid growth in the 1960s, peaking in the 1959-1969 period, a steady interest for the next two decades and then an abrupt decline beginning in the 1990s. These articles on the working class were not insignificant; even through the 21st century, the authors include a number of ASA presidents. But overall, working-class issues seem to have lost their salience, as if even American sociology was also telling them that they didn’t matter.

vanf2

Perhaps the Trump election, which was in part a symptom of this neglect, may also produce its cure. Election post-mortems in the media have focused more attention on the white working class than they have received in years.  Academe may soon follow.  Arlie Hochshild’s Strangers in Their Own Land, and, in political science, Katherine Cramer’s The Politics of Resentment, are encouraging signs. But Trump was certainly dangerous medicine for what ails our professional discourse.

Reeve Vanneman, PhD is in the sociology department at the University of Maryland.

1Recently Nadya Tolokonnikova was interviewed by NPR about Pussy Riot’s latest video. In it, Tolokonnikova explores themes of racism, xenophobia, and misogyny and its influence on governance through a graphic and violent imagined America under a Trump presidency. Trigger warning for… most things:

Tolokonnikova is making a statement about American politics, but she is clearly informed by Putin’s performance of masculinity and how that has translated into policy measures and electoral success. When he took office in early 2000, Putin needed to legitimize his power and counteract the global impression of Russian weakness after the collapse of the Soviet Union.

The projection of masculinity was a PR strategy: fishing and riding a horse shirtless, shooting a Siberian tiger, and emerging from the Black Sea in full scuba gear. These actions combined with bellicose foreign policy initiatives to portray Putin as assertive and unrelenting.

In the book, Sex, Politics, & Putin, Valerie Sperling makes a case that his strategy was successful. She investigates the political culture under Putin and argues there is popular support for Putin’s version of masculinity and its implications for femininity, even among young women. As a consequence, the gender and sexual politics of Russia have deviated from those of wider Europe, as indicated by the rise of the Russian slur “gayropa.”

The machismo and misogyny embodied by Putin have also translated into policy: the “gay propaganda” law, for example, and the ban on international adoption to gay couples. In his 2013 address to the Federal Assembly, Putin framed these policies as necessary to combat the “destruction of traditional values.”

While there is no systematic research on the role of masculinity in Trump’s rise to the national political stage in the US just yet, and while the nature of the link between Putin and Trump remains unclear (if one truly even exists), we should consider Putin’s Russia a cautionary tale. His performances of masculinity – his so-called “locker room talk,” discussion of genitalia size, and conduct towards pageant contestants — could go from publicity stunt to public support to actual policy measures. His bombastic language about defeating ISIS and the need for more American “strength” at home and abroad, for example, could easily translate into foreign policy.

Coverage of Trump during this election cycle is credited for hundreds of millions in profits for news agencies and Trump himself has enjoyed an unprecedented level of coverage. While Trump has benefited from far more airtime than Putin did in 2000, he has not been able to find the same level of popular support. At least not yet. When Putin rose to status as a national figure in Russia his approval rating was approximately 60%, and it grew from there to levels most American politicians only dream of. If Trump is willing and able to adopt other components of Putin’s leadership style, there is precedent for the possibility that his presidency could truly turn American back.

Alisha Kirchoff is a sociology PhD student at Indiana University-Bloomington. She has previously lived and worked in Russia and is currently working on research in political sociology, law and society, organizations, and gender. Her latest project is on fertility intentions and family policies in Putin’s Russia. You can follow her on twitter.

1Most Americans are either attracted to or repulsed by Donald Trump’s strong rhetoric around the “wall” between the US and Mexico. His plan is to build one taller and wider than the ones we already have, on the assumption that this will curb undocumented immigration and the number of migrants who live here.

But the idea isn’t just exciting or offensive, depending on who you’re talking to, it’s also wrong-headed. That is, there’s no evidence that building a better wall will accomplish what Trump wants and, in fact, the evidence suggests the opposite.

.

The data comes from a massive 30-year study led by sociologist Douglas Massey, published last month at the American Journal of Sociology and summarized at Made in America. He and his colleagues collected the migration histories of about 150,000 Mexican nationals who had lived for at least a time in the US and compared them with border policy. They found that:

  • More border enforcement changed where migrants crossed into the US, but not whether they did. More migrants were apprehended, but this simply increased the number of times they had to try to get across. It didn’t slow the flow.
  • Border enforcement did, though, make crossing more expensive and more dangerous, which meant that migrants that made it to the US were less likely to leave. Massey and his colleagues estimate that there are about 4 million more undocumented migrants in the US today than there would have been in the absence of enforcement.
  • Those who stayed tended to disperse. So, while once migrants were likely to stay along the border and go back and forth to Mexico according to labor demands, now they are more likely to be settled all across the US.

In any case, the economic impetus to migrate has declined; for almost a decade, the flow of undocumented migrants has been zero or even negative (more leaving than coming). So, Trump would be building a wall at exactly the moment that undocumented Mexican immigration has slowed. To put it in his terms, a wall would be a bad investment.

Lisa Wade, PhD is an Associate Professor at Tulane University. She is the author of American Hookup, a book about college sexual culture; a textbook about gender; and a forthcoming introductory text: Terrible Magnificent Sociology. You can follow her on Twitter and Instagram.

1In his speech accepting the Republican nomination for President, Donald Trump said (my emphasis):

…our plan will put America First. Americanism, not globalism, will be our credo. As long as we are led by politicians who will not put America First, then we can be assured that other nations will not treat America with respect.

Donald Trump’s insistence that we put “America First” hardly sounds harmful or irrational on its face. To be proud and protective of one’s country sounds like something good, even inevitable.  Americans are, after all, Americans. Who else would we put first?

But nationalism — a passionate investment in one’s country over and above others — is neither good nor neutral. Here are some reasons why it’s dangerous:

  • Nationalism is a form of in-group/out-group thinking. It encourages the kind of “us” vs. “them” attitude that drives sports fandom, making people irrationally committed to one team. When the team wins, they feel victorious (even though they just watched), and they feel pleasure in others’ defeat. As George Orwell put it:

A nationalist is one who thinks solely, or mainly, in terms of competitive prestige… his thoughts always turn on victories, defeats, triumphs and humiliations.

  • Committed to winning at all costs, with power-seeking and superiority as the only real goal, nationalists feel justified in hurting the people of other countries. Selfishness and a will to power — instead of morality, mutual benefit, or long-term stability — becomes the driving force of foreign policy. Broken agreements, violence, indifference to suffering, and other harms to countries and their peoples destabilize global politics. As the Washington Post said yesterday in its unprecedented editorial board opinion on Donald Trump, “The consequences to global security could be disastrous.”
  • Nationalism also contributes to internal fragmentation and instability. It requires that we decide who is and isn’t truly part of the nation, encouraging exclusionary, prejudiced attitudes and policies towards anyone within our borders who is identified as part of “them.” Trump has been clearly marking the boundaries of the real America for his entire campaign, excluding Mexican Americans, Muslims, African Americans, immigrants, and possibly even women. As MSNBC’s Chris Hayes tweeted on the night of Trump’s acceptance speech:

  • A nationalist leader will have to lie and distort history in order to maintain the illusion of superiority. A nationalist regime requires a post-truth politics, one that makes facts irrelevant in favor of emotional appeals. As Dr. Ali Mohammed Naqvi explained:

To glorify itself, nationalism generally resorts to suppositions, exaggerations, fallacious reasonings, scorn and inadmissible self-praise, and worst of all, it engages in the distortion of history, model-making and fable-writing. Historical facts are twisted to imaginary myths as it fears historical and social realism.

  • Thoughtful and responsive governance interferes with self-glorification, so all internal reflection and external criticism must be squashed. Nationalist leaders attack and disempower anyone who questions the nationalist program and aim to destroy social movements. After Trump’s acceptance speech, Black Lives Matter co-founder Patrisse Cullers responded: “He… threaten[ed] the vast majority of this country with imprisonment, deportation and a culture of abject fear.” Anyone who isn’t on board, especially if they are designated as a “them,” must be silenced.

When Americans say “America is the greatest country on earth,” that’s nationalism. When other countries are framed as competitors instead of allies and potential allies, that’s nationalism. When people say “America first,” expressing a willfulness to cause pain and suffering to citizens of other countries if it is good for America, that’s nationalism. And that’s dangerous. It’s committing to one’s country’s preeminence and doing whatever it takes, however immoral, unlawful, or destructive, to further that goal.

.

Lisa Wade, PhD is an Associate Professor at Tulane University. She is the author of American Hookup, a book about college sexual culture; a textbook about gender; and a forthcoming introductory text: Terrible Magnificent Sociology. You can follow her on Twitter and Instagram.

Are some Trump supporters’ political views motivated by race?

One way to find out is to see whether the typical Trump supporter is less likely to support policies when they are subtly influenced to think that they are helping black versus white people. This was the root of a study by political scientists Christopher Federico, Matthew Luttig, and Howard Lavine.

Prior to the election, they asked 746 white respondents to complete an internet survey. Each person was randomly assigned to see one of two pictures at the beginning of the survey: a white man standing next to a foreclosure sign or the exact same photograph featuring a black man. Respondents were also asked whether they supported Trump. (Non-white people were left out of the analysis because there were too few Trump supporters among them to run meaningful comparative statistics.)

The first graph shows that white Trump supporters were eight percentage points more likely to oppose mortgage relief if they had seen a “black cue” (the picture featuring a black man) than a “white cue.” The opposite was true for white Trump opponents.

3

When asked if they were “somewhat angry” about the assistance, the same pattern held:

4

And likewise when asked if the beneficiaries of mortgage assistance were at least “somewhat to blame” for their situation:

5

Findings held when the researchers controlled for possible confounding variables.

These findings aren’t particularly surprising. Others have also found that priming respondents to think of black people tends to make them tougher on crime and advocate for less generous social programs, like in this study on attitudes toward CA’s three-strikes law. What’s new here is the difference between Trump supporters and opponents. For opponents of Trump, priming made them more sympathetic toward mortgage holders; for supporters, priming made them less. This speaks to a real divide among Americans. Some of us feel real hostility toward African Americans. Others definitely do not.

Lisa Wade, PhD is an Associate Professor at Tulane University. She is the author of American Hookup, a book about college sexual culture; a textbook about gender; and a forthcoming introductory text: Terrible Magnificent Sociology. You can follow her on Twitter and Instagram.

Cross-posted at Cyborgology.

Fake news among the alt-right has been central in post-election public discourse, like with Donald Trump’s dubiously sourced tweet about the “millions of illegal voters” supposedly driving Clinton’s substantial lead in the popular vote. Less attention, however, has been paid to the way “real” news is, to use the sociologist Nathan Jurgenson’s term, based in “factiness,” described as “the feel and aesthetic of ‘facts,’ often at the expense of missing the truth.”  Mainstream news gets cast as objective in part because journalists, stack of papers and obligatory pen studiously in hand, point to statistics that back up their reports. Such reliance on “data” can mask the way that humans are involved in turning things into numbers and numbers into stories. So here I present a cautionary tale.

It is a common truism that white male voters without college degrees disproportionately supported Trump in the 2016 election. Indeed, the notion that men with high school as their highest level of education were more likely to vote for Trump is an empirically supported fact. This data point spread widely throughout the campaign season, and bore out in the post-election analyses. But also in the post-election analyses — over which researchers poured in response to the statistically surprising result — another data point emerged that could have, but didn’t, change the narrative around this demographic voting bloc.

The data point that emerged was that white American men without college degrees have remained economically depressed since the 2008 recession and subsequent recovery. Although the U.S. economy has been steadily improving, the economic reality for this particular segment of the population has not. This is what Michael Moore talked about experientially (but not statistically), claiming that he knows the people who live in the rust belt, and they are struggling. He was right, the data show that they are struggling. Highlighting the economic reality for people without college degrees in the U.S. tells a very different story than highlighting the fact that they don’t have college degrees. The former renders an image of a voting contingent who, in the face of personal economic hardship that contrasts with national economic gain, are frustrated and eager to try something — anything — new. The latter renders an image of ignorance.

Data about education levels of voters is transformed by its coupling with economic trajectories. What’s been strange, is that although this coupling was discovered, it never really penetrated the larger “what happened” narrative. This is particularly strange given the meticulous and sometimes frantic search for explanation and the media’s public introspective quests to understand how so many got it all so wrong.

The transformative effect of the economic data point and its failure to effectively transform the story underlines two related things: data are not self-evident and narrative currents are hard to change.

The data weren’t wrong — people without college degrees were more likely to vote for Trump — but they were incomplete and in their partialness, quite misleading. That’s not a data problem, it’s a people problem. Data are not silent, but they are inarticulate. Data make noise, but people have to weave that noise into a story. The weaving process begins with survey construction, and culminates in analyses and reports. Far from an objective process, turning data into narrative entails nuanced decisions about the relevance of, and relationship between, quantifiable items captured through human-created measures. The data story is thus always value-laden and teeming with explicit and implicit assumptions.

Framing a contingent of Trump supporters through the exclusive metric of education without examining the interaction, mediating, and moderating effects of economic gains, was an intellectual decision bore out through statistical analyses. That is, pollsters, strategists, and commentators treated “lack of education” as the variable with key explanatory power. Other characteristics or experiences of those with low levels of education could/should/would be irrelevant.

Such dismissal created a major problem with regard to Democratic strategy. To situate a voting bloc as “uneducated” is to dismiss that voting bloc. How does one campaign to those voting in ignorance? In contrast, to situate a voting bloc as connected through an economic plight not only validates their position, but also gives a clear policy platform on which to speak.

But okay, after the election, analysts briefly shed light on the way that economics and education operated together to predict candidate preference. Why has this gotten so little attention? Why is education — rather than economics or the economic-education combination — still the predominant story?

The predominance of education remains because narrative currents are strong. Even when tied to newly emergent data, established stories are resistant to change. Narratives are embedded with social frameworks, and changing the story entails changing the view of reality. A key tenet of sociology is that people tend towards stability. Once they understand and engage the world in a particular way, they do social and psychological gymnastics to continue understanding and engaging the world in that way. To reframe (some) Trump voters as part of an economic interest group that has been recently underserved, is an upheaval of previous logics. Moreover, disrupting existing logics in this way forces those who practice those logics to, perhaps, reframe themselves, and do so in a way that is not entirely flattering or identity affirming. To switch from a frame of ignorance to a frame of economics is to acknowledge not only that the first frame was distorted, but also, to acknowledge that getting it wrong necessarily entailed ignoring the economic inequality that progressives take pride in caring so much about. Switching from ignorance to economics entails both a change in logic and also, a threat to sense of self.

Data are rich material from which stories are formed, and they are not objective. Tracing data is a process of deconstructing the stories that make up our truths — how those stories take shape, evolve, and solidify into fact. The “truth” about Trump voters is of course complex and highly variable. The perpetually missed nuances tell as much of a story as those on which predominant narratives hang.

Jenny L. Davis, PhD, is in the department of sociology at James Madison University. She studies social psychology, experimental research methods, and new and social media. She is also a contributing author and editor at Cyborgology.  You can follow her at @Jenny_L_Davis.

According to the Southern Poverty Law Center, the US saw a spike of hate incidents after the election of Donald Trump on November 8th. 867 real-world (i.e., not internet-based) incidents were reported to the Center or covered in the media in just 10 days. USA Today reports that the the Council on American-Islamic relations also saw an uptick in reports and that the sudden rise is greater than even what the country saw after the 9/11 attacks. This is, then, likely just a slice of what is happening.

The Center doesn’t present data for the days coming up to the election, but offers the following visual as an illustration of what happened the ten days after the 8th.

2

If the numbers of reports prior to the 8th were, in fact, significantly lower than these, than there was either a rise in incidents after Trump’s victory and Clinton’s loss, or an increase in the tendency to report incidents. Most perpetrators of these attacks targeted African Americans and perceived immigrants.

8

The most common place for these incidents to occur, after sidewalks and streets, was K-12 schools. Rosalind Wiseman, anti-bullying editor and author of Queen Bees and Wannabes, and sociologist CJ Pascoe, author of Dude, You’re a Fag, both argue that incidents at schools often reflect adult choices. Poor role models — adults themselves who bully or who fail to stand up for the bullied — make it hard for young people to have the moral insight and strength to do the right thing themselves.

Lisa Wade, PhD is an Associate Professor at Tulane University. She is the author of American Hookup, a book about college sexual culture; a textbook about gender; and a forthcoming introductory text: Terrible Magnificent Sociology. You can follow her on Twitter and Instagram.