politics: election 2016

The margin of error is getting more attention than usual in the news. That’s not saying much since it’s usually a tiny footnote, like those rapidly muttered disclaimers in TV ads (“Offer not good mumble mumble more than four hours mumble mumble and Canada”). Recent headlines proclaim, “Trump leads Bush…” A paragraph or two in, the story will report that in the recent poll Trump got 18% and Bush 15%.  That difference is well within the margin of error, but you have to listen closely to hear that. Most people usually don’t want to know about uncertainty and ambiguity.

What’s bringing uncertainty out of the closest now is the upcoming Republican presidential debate. The Fox-CNN-GOP axis has decided to split the field of presidential candidates in two based on their showing in the polls. The top ten will be in the main event. All other candidates – currently Jindal, Santorum, Fiorina, et al. – will be relegated to the children’s table, i.e., a second debate a month later and at the very unprime hour of 5 p.m.

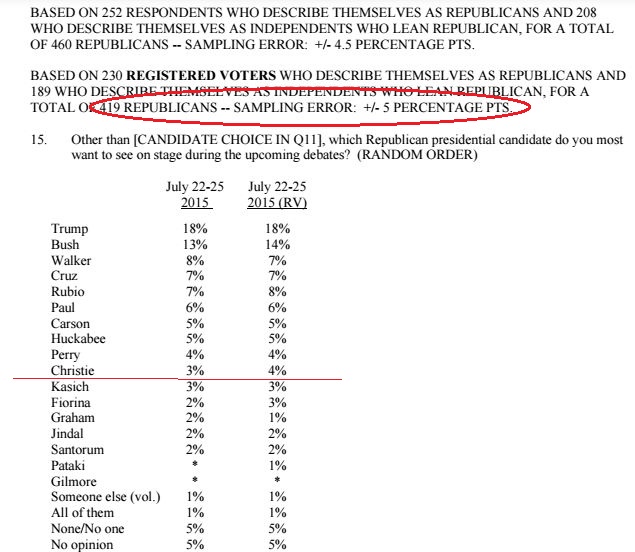
But is Rick Perry’s 4% in a recent poll (419 likely GOP voters) really in a different class than Bobby Jindal’s 25? The margin of error that CNN announced in that survey was a confidence interval of  +/- 5.  Here’s the box score.

2
Jindal might argue that, with a margin of error of 5 points, his 2% might actually be as high as 7%, which would put him in the top tier.He might argue that, but he shouldn’t.  Downplaying the margin of error makes a poll result seem more precise than it really is, but using that one-interval-fits-all number of five points understates the precision. That’s because the margin of error depends on the percent that a candidate gets. The confidence interval is larger for proportions near 50%, smaller for proportions at the extreme.

Just in case you haven’t taken the basic statistics course, here is the formula.
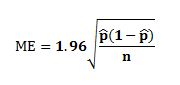
4
The   (pronounced “pee hat”) is the proportion of the sample who preferred each candidate. For the candidate who polled 50%, the numerator of the fraction under the square root sign will be 0.5 (1-0.5) = .25.  That’s much larger than the numerator for the 2% candidate:  0.02 (1-0.02) = .0196.*Multiplying by the 1.96, the 50% candidate’s margin of error with a sample of 419 is +/- 4.8. That’s the figure that CNN reported. But plug in Jindal’s 2%, and the result is much less: +/- 1.3.  So, there’s a less than one in twenty chance that Jindal’s true proportion of support is more than 3.3%.

Polls usually report their margin of error based on the 50% maximum. The media reporting the results then use the one-margin-fits-all assumption – even NPR. Here is their story from May 29 with the headline “The Math Problem Behind Ranking The Top 10 GOP Candidates”:

There’s a big problem with winnowing down the field this way: the lowest-rated people included in the debate might not deserve to be there.

The latest GOP presidential poll, from Quinnipiac, shows just how messy polling can be in a field this big. We’ve put together a chart showing how the candidates stack up against each other among Republican and Republican-leaning voters — and how much their margins of error overlap.

14


The NPR writer, Danielle Kurtzleben, does mention that “margins might be a little smaller at the low end of the spectrum,” but she creates a graph that ignores that reality.The misinterpretation of presidential polls is nothing new.  But this time that ignorance will determine whether a candidate plays to a larger or smaller TV audience.

—————————–

* There are slightly different formulas for calculating the margin of error for very low percentages.  The Agresti-Coull formula gives a confidence interval even if there are zero Yes responses. (HT: Andrew Gelman)

Originally posted at Montclair SocioBlog.

Jay Livingston is the chair of the Sociology Department at Montclair State University. You can follow him at Montclair SocioBlog or on Twitter.

Jennifer Pozner, Kat Lazo, Zerlina Maxwell, and Samhita Mukhopadhyay join Jay Smooth to discuss a few no-nos for the media this campaign season. Pozner sums it up:

Look, this matters. By focusing on personal, gendered, irrelevant details about women politicians, this conditions the American public to think that woman are ladies first [and] leaders only a distant second. Media play a serious role in keeping half the population out of the political talent pool.

Enjoy:

Lisa Wade, PhD is an Associate Professor at Tulane University. She is the author of American Hookup, a book about college sexual culture; a textbook about gender; and a forthcoming introductory text: Terrible Magnificent Sociology. You can follow her on Twitter and Instagram.

Black people in the U.S. vote overwhelmingly Democratic. They also have, compared to Whites, much higher rates of infant mortality and lower life expectancy. Since dead people have lower rates of voting, that higher mortality rate might affect who gets elected. What would happen if Blacks and Whites had equal rates of staying alive?

1b

The above figure is from the recent paper, “Black lives matter: Differential mortality and the racial composition of the U.S. electorate, 1970-2004,” by Javier Rodriguez, Arline Geronimus, John Bound and Danny Dorling.  A summary by Dean Robinson at the The Monkey Cage summarizes the key finding.

between 1970 and 2004, Democrats would have won seven Senate elections and 11 gubernatorial elections were it not for excess mortality among blacks.

At Scatterplot, Dan Hirschman and others have raised some questions about the assumptions in the model. But more important than the methodological difficulties are the political and moral implications of this finding. The Monkey Cage account puts it this way:

given the differences between blacks and whites in their political agendas and policy views, excess black death rates weaken overall support for policies — such as antipoverty programs, public education and job training — that affect the social status (and, therefore, health status) of blacks and many non-blacks, too.

In other words, Black people being longer-lived and less poor would be antithetical to the policy preferences of Republicans. The unspoken suggestion is that Republicans know this and will oppose programs that increase Black health and decrease Black poverty in part for the same reasons that they have favored incarceration and permanent disenfranchisement of people convicted of felonies.

That’s a bit extreme.  More stringent requirements for registration and felon disenfranchisement are, like the poll taxes of an earlier era, directly aimed at making it harder for poor and Black people to vote.  But Republican opposition to policies that would  increase the health and well-being of Black people is probably not motivated by a desire for high rates of Black mortality and thus fewer Black voters. After all, Republicans also generally oppose abortion. But, purely in electoral terms, reducing mortality, like reducing incarceration, would not be good for Republicans.

Cross-posted at Montclair SocioBlog.

Jay Livingston is the chair of the Sociology Department at Montclair State University. You can follow him at Montclair SocioBlog or on Twitter.

Cross-posted at Montclair SocioBlog.

Jeb Bush told CPAC that the Republican party had an image problem.

Way too many people believe that Republicans are anti-immigrant, anti-woman, anti-science, anti-gay, anti-worker.

People have good reason to believe those things.  But the “way too many” suggests that the GOP’s problem is not image or brand, it’s demography.  For five years or longer, the Republican faithful have been complaining that “their” country was being taken away from them, and they were going to take it back (e.g., see my “Repo Men” post).

They were right.  Their country, a country dominated by older white men, is fading in the demographic tide.  The groups whose numbers in the electorate are on the rise don’t look like them.  Andrew Gelman (here) recently published these graphs as an update to his 2009 Red State, Blue State.  They reveal the tendency for different groups to vote more Democratic (blue) and Republican (red):

1

(The exit poll the data are based on sampled only in the 30 most competitive state. Texas and Georgia are large, and they have significant non-White populations. But demographic changes there are unlikely to have much effect on which party gets their electoral votes.)

Unfortunately for the GOP, the non-White proportion of the electorate will continue to grow. The female proportion may also increase, especially as education levels of women rise (more educated people are more likely to vote than are the less educated).

The key factor is party loyalty.  And, at least in presidential elections, people do remain loyal. I think I once read, “If you can get them for two consecutive elections, you’ve got them for life.”  Or words to that effect.  If that’s true, the age patterns of the last two elections should be what the Republicans are worrying about.

2

Trying to make themselves more attractive to younger people will not be easy.  Oldsmobile tried it not so long ago (a post on that campaign is here).  “This is not your father’s GOP” might have similar lack of success.  But insisting that this is still your father’s GOP (or more accurately, some white dude’s father’s GOP) seems like a formula for failure.

Jay Livingston is the chair of the Sociology Department at Montclair State University. You can follow him at Montclair SocioBlog or on Twitter.