health/medicine

While I’m most well-known for my work on hook up culture, I’ve written extensively on a different topic altogether: how Americans talk about female genital cutting practices (FGCs), better known as female genital “mutilation.”  While FGCs are passionately opposed by essentially all Americans who learn about them, our understanding of the practices is, in fact, skewed by misinformation, ethnocentrism, and a history of portraying Africa as naively “backwards” or cruelly “barbaric.”

The main source of distortion has been the mass media.  Aiming to encourage journalists to think twice when covering the topic, the Hastings Center has released a report by the Public Policy Advisory Network on Female Genital Surgeries in Africa.  In the rest of this post, I briefly discuss some of the things they want journalists — and the rest of us — to know and add a couple of my own:

Using the word “mutilation” is counterproductive.

People who support genital cutting typically believe that a cut body is a more aesthetically pleasing one.  The term “mutilation” may appeal to certain Westerners, but people in communities where cutting occurs largely find the term confusing or offensive.

Media coverage usually focuses on one of the more rare types of genital cutting: infibulation.

Infibulation involves trimming and fusing the labia so as to close the vulva, leaving an opening in the back for intercourse, urination, and menses.  In fact, 10% of the procedures involve infibulation.  The remainder involve trimming, cutting, or scarification of the clitoris, clitoral hood (prepuce), or labia minora or majora.  While none of these procedures likely sound appealing, some are more extensive than others.

Research has shown that women with cutting are sexually responsive.

Women who have undergone genital surgeries report “rich sexual lives, including desire, arousal, orgasm, and satisfaction…”  This is true among women who have experienced clitoral reductions and undergone infibulation, as well as women who’ve undergone lesser forms of cutting.

Health complications of genital cutting “represent the exception rather than the rule.”

News reports often include long lists of acute and long-term negative medical consequences of FGCs, and these may feel intuitively true, but efforts to document their incidence suggest that health problems are, for the most part, no more common in cut than uncut women.  The Report concludes: “…from a public health point of view, the vast majority of genital surgeries in Africa are safe, even with current procedures and under current conditions.”

Girls are not generally cut in response to the influence of cruel patriarchs.

Most societies that cut girls also cut boys; some groups that engage in cutting have relatively permissive sexual rules for women, some do not; and female genital cutting practices are typically controlled and organized by women (correspondingly, men control male genital surgeries).

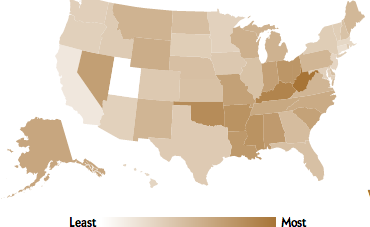
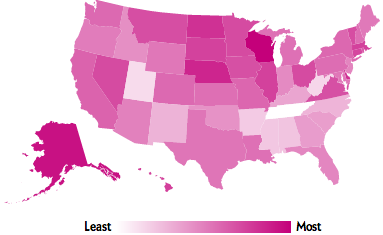
FGCs are not an “African practice.”

The procedures we label “female genital mutilation” occur only in some parts of Africa and occur outside of the continent as well (source):

Moreover, cosmetic genital surgeries in the U.S. are among the fastest growing procedures.  These include clitoral reduction, circumcision of the clitoral foreskin, labia trimming, and vaginal tightening, not to mention mons liposuction, collagen injected into the g-spot, color correction of the vulva, and anal bleaching.  While it would be simplistic to say that these are the same as the procedures we typically call “mutilation,” they are not totally different either.

Western-led efforts to eliminate FGCs are largely ineffective and sometimes backfire.

It turns out that people don’t appreciate being told that they are barbaric, ignorant of their own bodies, or cruel to their children.  Benevolent strangers who try to stop cutting in communities, as well as top-down laws instituted by politicians (often in response to Western pressure), are very rarely successful.  The most impressive interventions have involved giving communities resources to achieve whatever goals they desire and getting out of the way.

In sum, it’s high time Americans adopt a more balanced view of female genital cutting practices.  Reading The Hastings Center Report is a good start.  You might also pick up Genital Cutting and Transnational Sisterhood by Stanlie James and Claire Robertson.  Full text links to my papers on the topic, including a discourse analysis of 30 years of the academic conversation, can be found here.

————————

Lisa Wade is a professor of sociology at Occidental College.  She frequently delivers public lectures about female genital cutting. You can follow her on Twitter and Facebook.

Along with “work/life balance” and other tired topics, an evergreen issue in the media remains the controversies surrounding breastfeeding.  Less than six months ago, Jamie Lynne Grumet lit up the blogosphere by posing for the cover of TIME Magazine while breastfeeding her standing toddler.  Outcry included pronouncements that the image was almost pornographic, psychologically damaging to her child, and exploitative of her white, twenty-something good looks.  The drama of the image worked as the magazine flew off shelves and was named one of the top ten most controversial covers by the New York Daily News.

Within the “lactivist” community there seemed to be double-edged concern — on one hand, glee that an image of a breastfeeding woman was so publicly displayed — on the other, anger that the image so clearly did not depict the intimacy and bonding between mother and child that they insist breastfeeding promotes.

Sensing an opportunity to “set the record straight” as well as launch their own uptick in cover attention, the nonprofit quarterly magazine Pathways to Family Wellness persuaded Grumet to pose for them, this time surrounded by her husband, adopted son, and cradling her nursing naked now 4-year-old child in her lap.  The inclusion of other family members changes the image from one of solo defiance to a message about her family system.  On the cover, Grumet still looks directly at the camera, not at her feeding child, but her glance is far from defiant.

Grumet agreed to pose again in order to send a different message about breastfeeding, one she preferred.  Grumet has said that this image portrays toddler breastfeeding more realistically, “incorporating the husband and siblings.” Yet, the multicultural family portrait has its own sense of staging.   The idyllic family pile-on seems hardly part of everyday life, much less every feeding.  Both images – part of the wider debate over breastfeeding — are carefully crafted to tell a particular story.

Some critics have mentioned that while Grumet’s intention may have been to reframe the image of breastfeeding, perhaps unwittingly again, she has contributed to the fanning of the flames around this issue. Others have accused her of “milking the moment.”   The breastfeeding support website KellyMom tracked down the three other mothers who were all photographed for the TIME cover. KellyMom interviewed them about their experiences during the shoot, then reaction to, and fallout from the cover.  Unfortunately, given the nature of the debate, individual women can often seem like pawns in these ever-intermittent media storms.

————————

Elline Lipkin, PhD, is a Research Scholar with UCLA’s Center for the Study of Women.  She is the author of Girls’ Studies and The Errant Thread, recipient of the Kore Press First Book Award for Poetry. She tweets at @girlsstudies.

In a now-unfamiliar advertising strategy, this 1936 Thanksgiving-themed ad for whiskey suggests you make the scientifically “wholesome” choice: Seagram’s Crown.

Partial transcript:

Months of research by a group of trained, impartial men brought the answer: Seagram’s Crown Whiskies, used in moderation, are kind, considerate whiskies, and most likely to agree with the average man… they are thousands of men’s choice AS A MOST WHOLESOME FORM OF WHISKEY, besides!  Choose them at the bar for your present pleasure without future penalty.

I’d like to practice… er, review the research methods.

Found at Vintage Ads.  Just for fun, see also: Whiskey-flavored toothpaste.

—————————

Lisa Wade is a professor of sociology at Occidental College. You can follow her on Twitter and Facebook.

Mark Fischetti has posted an interactive graphic at Scientific American that lets you look at the prevalence of several behaviors or characteristics measured on the Centers for Disease Control and Prevention’s survey on risk factors. The graphic includes data on exercise, tobacco use, heavy drinking, binge drinking, and obesity. Commenters on the post suggested it’s unnecessarily snarky about obesity; that said, it provides a quick snapshot of several behaviors demographers often use to judge general trends in health. For each topic, a graph shows the state where it is highest and lowest; you can also select up to 3 additional states to compare.

For instance, the percent of people who took part in a physical activity in the last month is highest in Oregon and lowest in Mississippi; I added my home state of Oklahoma (dark blue) and current residence of Nevada (light blue) too:

You also get a map for each topic that shows where it’s most or least common. Here’s the map for smoking:

Sconnies, you may not be surprised to know that Wisconsin leads the nation in binge drinking:

I can’t embed the graphic, so you’ll have to go to Scientific American’s post to play around and compare your own state.

The New York Times‘ Sabrina Tavernise reports that the long term trend of increasing life expectancy has reversed it self among one specific group of people.  Between 1990 and 2008, the life expectancy of White men and women without high school degrees has dropped.  Women have lost five years, men three.

The difference in the life expectancy between men and women without high school degrees and those who complete college are even more striking.  Women with a college degree can expect to live, on average, more than 10 years longer than high school drop outs.  Among men, the gap is even larger, a whopping 13 years.

The words “alarming” and “vexing” were used to describe this drop in life expectancy.  Scholars are still unsure of its causes, but note the stress of balancing work and family, “a spike in prescription drug overdoses among young whites, higher rates of smoking among less educated white women, rising obesity, and a steady increase in the number of the least educated Americans who lack health insurance.”

Ultimately, they argue, as fewer and fewer people fail to graduate from high school, the concentration of disadvantages in those that do are making this population especially vulnerable to all kinds of ills, some of which kill them.

Hat tip to The Global Sociology Blog.

Lisa Wade, PhD is an Associate Professor at Tulane University. She is the author of American Hookup, a book about college sexual culture; a textbook about gender; and a forthcoming introductory text: Terrible Magnificent Sociology. You can follow her on Twitter and Instagram.

In light of Romney’s comments regarding those who depend on the government, we thought we’d re-post this great data showing that many people who are using government social programs don’t know they are doing so.  

————————

Dolores R. sent in a fascinating image posted at boingboing. It comes from a paper by Suzanne Mettler, a professor in the Department of Government at Cornell. Mettler first asked survey participants whether they had ever used a federal U.S. government program. Then later in the survey she specifically asked respondents whether they had ever benefited from or participated in specific federal programs. As it turns out, large number of people who have benefited from various federal programs or policies do not recognize themselves as having done so. This table shows what percent of people who said they had participated in or used these 19 federal programs had earlier in the surveys said they had never used any social program:

Mettler argues that recipients are less likely to recognize themselves as benefiting from programs that are part of what she calls the “submerged state” — programs and policies that provide incentives and motivations for particular behaviors in the private sector, rather than overtly directing behavior. If you receive food stamps, you interact directly with a government agency, are required to periodically meet with a government worker and reapply to re-establish eligibility, and can point to a specific thing that links you to the program (these days usually a debit-type card rather than the old style coupons/stamps).

On the other hand, if you participate in the government’s mortgage interest deduction program, which encourages home ownership by allowing people to deduct the cost of mortgage interest from their taxable income (which you can’t do with rent costs, for instance), it’s less noticeable that you are benefiting from a federal policy. You get a form from your mortgage company that provides the relevant number, and you transfer it over to the correct line when you’re filling out taxes.

Notably, the programs recipients seem least likely to recognize as a government program are among those the middle (and higher) classes are most likely to use, while those more common among the poor are more clearly recognizable to those using them as government programs. Yet allowing you to write off mortgage interest (but not rent), or charitable donations, or the money you put aside for a child’s education, are all forms of government programs, ones that benefit some more than others. But the “submerged” nature of these policies hides the degree to which the middle and upper classes use and benefit from federal programs.

Cross-posted at Reports from the Economic Front.

Politicians always seem to be talking about the middle class.  They need some new focus groups.  According to the Pew Research Center, over the past four years the percentage of adult Americans that say they are in the lower class has risen significantly, from a quarter to almost one-third (see chart below).

Pew also found that the demographic profile of the self-defined lower class has also changed.  Young people, according to Pew, “are disproportionately swelling the ranks of the self-defined lower classes.”   More specifically some 40% of those between 18 to 29 years of age now identify as being in the lower classs compared to only 25% in 2008.

Strikingly, the percentage of whites and blacks that see themselves in the lower class is now basically equal.  The percentage of whites who consider themselves in the lower class rose from less than a quarter in 2008 to 31% in 2012.  This brought them in line with blacks, whose percentage remained at a third.  The percentage of Latinos describing themselves as lower class rose to 40%, a ten percentage point increase from 2008.

And not surprisingly, as the chart below shows, many who self-identify as being in the lower class are experiencing great hardships.   In fact, 1 in 3 faced four or all five of the problems addressed in the survey.

In short, there is a lot of hurting in our economy.

In 1956 sociologist C. Wright Mills published a book titled The Power Elite.  In it, he argued that our democracy was corrupt because the same people exercised power in business, the military, and politics.  This small group, with so many important roles and connections, had an influence on our society that was far out-of-proportion with their numbers.  This, he concluded, was a dire situation.

Fast forward to 2012 and Lambert Strether posted a series of Venn diagrams at Naked Capitalism.  Strether writes:

[This] nifty visualization… shows how many, many people, through the operations of Washington’s revolving door, have held high-level positions both in the Federal government and in major corporations. To take but one example, the set of all Treasury Secretaries includes Hank Paulson and Bob Rubin, which overlaps with the set of all Goldman Sachs COOs. The overlapping is pervasive. Political scientists and the rest of us have names for such cozy arrangements — oligarchy, corporatism, fascism, “crony capitalism” — but one name that doesn’t apply is democracy.

UPDATE: I’ve included a criticism of the methodology after the diagrams; the overlap portrayed here is almost exclusively among Democratic politicians and the diagrams were explicitly intended to point out connections among progressives.

See for yourself:

On the methods for putting together these diagrams, Strether writes about the person who’s behind the diagrams:

Herman’s honest: Her goal is to “expose progressive corporatism,” and — assuming for the sake of the argument that D[emocrat]s are progressive, and that “progressives” are progressive — her chart does exactly that, and very effectively, too.

But what her data does not do is expose corporatism as such; there are very, very few Rs listed; it strains credulity that Hank Paulson was the only high-level GS operative in the Bush administration, for example, and if GS isn’t the R[epublican]s’ favorite bank, there’s surely another.

Hence, Herman’s chart, if divorced from context[2], might lead somebody — say, a child of six — to conclude that the only corporatists in Washington DC are D[emocrat]s.

Thanks to Carolyn Taylor for pointing out the methods bias.

Lisa Wade, PhD is an Associate Professor at Tulane University. She is the author of American Hookup, a book about college sexual culture; a textbook about gender; and a forthcoming introductory text: Terrible Magnificent Sociology. You can follow her on Twitter and Instagram.