education

In light of Romney’s comments regarding those who depend on the government, we thought we’d re-post this great data showing that many people who are using government social programs don’t know they are doing so.  

————————

Dolores R. sent in a fascinating image posted at boingboing. It comes from a paper by Suzanne Mettler, a professor in the Department of Government at Cornell. Mettler first asked survey participants whether they had ever used a federal U.S. government program. Then later in the survey she specifically asked respondents whether they had ever benefited from or participated in specific federal programs. As it turns out, large number of people who have benefited from various federal programs or policies do not recognize themselves as having done so. This table shows what percent of people who said they had participated in or used these 19 federal programs had earlier in the surveys said they had never used any social program:

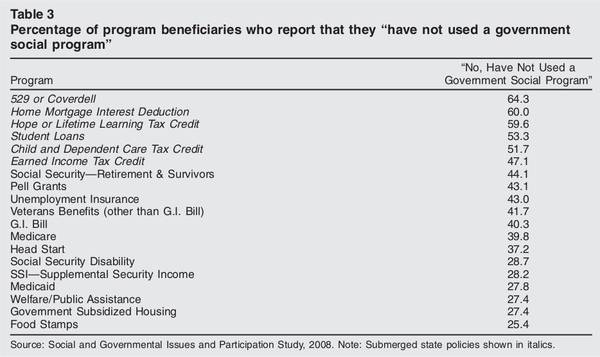
Mettler argues that recipients are less likely to recognize themselves as benefiting from programs that are part of what she calls the “submerged state” — programs and policies that provide incentives and motivations for particular behaviors in the private sector, rather than overtly directing behavior. If you receive food stamps, you interact directly with a government agency, are required to periodically meet with a government worker and reapply to re-establish eligibility, and can point to a specific thing that links you to the program (these days usually a debit-type card rather than the old style coupons/stamps).

On the other hand, if you participate in the government’s mortgage interest deduction program, which encourages home ownership by allowing people to deduct the cost of mortgage interest from their taxable income (which you can’t do with rent costs, for instance), it’s less noticeable that you are benefiting from a federal policy. You get a form from your mortgage company that provides the relevant number, and you transfer it over to the correct line when you’re filling out taxes.

Notably, the programs recipients seem least likely to recognize as a government program are among those the middle (and higher) classes are most likely to use, while those more common among the poor are more clearly recognizable to those using them as government programs. Yet allowing you to write off mortgage interest (but not rent), or charitable donations, or the money you put aside for a child’s education, are all forms of government programs, ones that benefit some more than others. But the “submerged” nature of these policies hides the degree to which the middle and upper classes use and benefit from federal programs.

Cross-posted at Montclair SocioBlog.

The New York Times ran these graphics showing the word frequencies of the Republican and Democratic conventions.  I’ve added underlining on the keywords that seem to differentiate the two conventions. (The data on the Democrats runs only through Sept. 4, but it looks like the themes announced early on will be the ones that are repeated.)

Both parties talked about leadership, the economy, jobs, and families.  More interesting are the differences.  Democrats talked a lot about Women, a word which seems to be absent from the Republican vocabulary.  The Democrats also talked about Health and Education.  I find it curious that Education does not appear in the Republican word cloud.

The Republican dictionary falls open to the page with Business – ten times as many mentions as in the Democrats’ concordance.  If you go to the interactive Times graphic, you can click on Business and see examples of the contexts for the word.  Many of these excerpts also contain the word Success.

You can put the large-bubble words in each graphic in a sentence that condenses the party’s message about government, though that word – Government – does not appear in either graphic.   For the Republicans, government should lower Taxes so that Business can Succeed, creating Jobs.

For the Democrats, government should protect the rights of Women and ensure that everyone has access to Health and Education.

Perhaps the most telling most interesting word in the Democratic cloud is Together.  The Republican story is one of individual success in business, summed up in their repeated phrase, “I built that.”  The Democrats apparently are emphasizing what people can accomplish together.  These different visions are not new.  They go back at least to the nineteenth century.  (Six years ago, I blogged here about these visions as NFL brands — Cowboys and Steelers — and their parallels in US politics.)

(HT: Neal Caren who has posted his own data about the different balance of emotional expression at the two conventions.)

Cross-posted at Montclair SocioBlog.

As I speculated years ago (here and here), it may be hard for Americans to imagine a world where the law guarantees them at least 20 paid vacation days per year.  But such a world exists.  It’s called Europe.*

Americans are the lucky ones.  As Mitt Romney has warned us “European-style benefits” would   “poison the very spirit of America.”  Niall Ferguson, who weighs in frequently on history and economics, contrasts America’s “Protestant work ethic” with what you find in Europe – an “atheist sloth ethic.”

The graph is a bit misleading. It shows only what the law requires of employers.  Americans do get vacations.  But here in America, how much vacation you get, or whether you get any at all, and whether it’s paid – that all depends on what you can negotiate with your employer.

Since American vacations depend on what the boss will grant, some people get more paid vacation, some get less, and some get none.  So it might be useful to ask which sectors of our economy are beehives of the work ethic and which are sloughs of sloth.  (Ferguson’s employer, for example, Harvard University, probably gives him three months off in the summer, plus a week or two or more in the winter between semesters, plus spring break, and maybe a few other days.  I wonder how he would react if Harvard did away with these sloth-inducing policies.)

The Wall Street Journal recently (here) published a graph of BLS data on access to paid vacations; they break it up by industry near the bottom.

Those people who are cleaning your hotel room and serving your meals while you’re on vacation — only about one in four can get any paid vacation days.  And at the other end, which economic sector is most indulgent of sloth among its workforce?  Wall Street.  Four out of five there get paid vacation.

How much paid vacation do we get?  That depends on sector, but it also depends on length of service.  As the Journal says,

Europeans also get more time off: usually a bare minimum of four weeks off a year. Most Americans have to stay in a job for 20 years to get that much, according to BLS data.

—————————

* The graph is from five years ago, but I doubt things have changed much. The US still has no federal or state laws requiring any paid vacation days.

Today is the first day of school at the college where I teach, so I thought it would be a nice time to re-post this oldie-but-goodie on the relationship between income and SAT scores.  I’m sure all of our students are brilliant, of course, but whether the SAT measures intelligence fairly is up for debate.

The College Board is an education association that, among other things, administers the SAT college entrance examination.  A report on the scores from 2009, reviewed by the New York Times, included a break down of scores by the household income of the student. Scores correlate strongly and positively with income:

I can think of two explanations for the correlation.

First, it is certainly true that children with more economic resources, on average, end up better prepared for standardized tests.  They tend to have better teachers, more resource-rich educational environments, more educated parents who can help them with school and, sometimes, expensive SAT tutoring.

Second, the test itself may be biased towards wealthier students.  These tests tend to be written and evaluated by privileged individuals who may inadvertently include class-based knowledge, not just knowledge, in the exam (asking questions, for example, that rely on background information about golf instead of basketball).

In any case, this correlation should give us pause; it calls into question, quite profoundly, the extent to which the SAT is functioning as a fair measure.  Perhaps it measures preparedness for college, but whether it measures potential is up for debate.

Lisa Wade, PhD is an Associate Professor at Tulane University. She is the author of American Hookup, a book about college sexual culture; a textbook about gender; and a forthcoming introductory text: Terrible Magnificent Sociology. You can follow her on Twitter and Instagram.

Hanna Rosin, senior editor at The Atlantic and author of The End of Men, has written a piece about hook up culture on and off college campuses for the September issue of her magazine.  Given that I’ve done some research on hook up culture, W.W. Norton’s Karl Bakeman asked me to weigh in.  So, here are my two cents: Rosin isn’t wrong to argue that the culture offers women sexual opportunities and independence, but she mischaracterizes the objections to hook up culture and draws too rosy a conclusion.

Those who wring their hands and “lament” hook up culture, Rosin contends, do so because they think women are giving it up too easily, a practice that will inevitably leave them heartbroken.`She writes:

[Critics of hook up culture pine] for an earlier time, when fathers protected “innocent” girls from “punks” and predators, and when girls understood it was their role to also protect themselves.

If this is the problem, the answer is less sex and more (sexless?) relationships.  But, Rosin rightly argues, this wrongly stereotypes women as fragile flowers whose self-esteem lies between their legs.  It also romanticizes relationships.  Drawing on the fantastic research of sociologists Laura Hamilton and Elizabeth Armstrong, she explains that young women often find serious relationships with men to be distracting; staying single (and hooking up for fun) is one way to protect their own educational and career paths.

All this is true and so, Rosin concludes, hook up culture is “an engine of female progress — one being harnessed and driven by women themselves.”

Well, not exactly.  Yes, women get to choose to have sex with men casually and many do.  And some women truly enjoy hook up culture, while others who like it less still learn a lot about themselves and feel grateful for the experiences.  I make this argument with my colleague, Caroline Heldman, in Hooking Up and Opting Out: Negotiating Sex in the First Year of College.

But what young women don’t control is the context in which they have sex.  The problem with hook up culture is not casual sex, nor is it the fact that some women are choosing it, it’s the sexism that encourages men to treat women like pawns and requires women to be just as cunning and manipulative if they want to be in the game; it’s the relentless pressure to be hot that makes some women feel like shit all the time and the rest feel like shit some of the time; it’s the heterosexism that marginalizes and excludes true experimentation with same-sex desire; and it’s the intolerance towards people who would rather be in relationships or practice abstinence (considered boring, pathetic, or weird by many advocates of hook up culture including, perhaps, Rosin).

Fundamentally, what’s wrong with hook up culture is the antagonistic, competitive, malevolent attitude towards one’s sexual partners.  College students largely aren’t experimenting with sexuality nicely.  Hook ups aren’t, on the whole, mutually satisfying, strongly consensual, experimental affairs during which both partners express concern for the others’ pleasure.   They’re repetitive, awkward, and confusing sexual encounters in which men have orgasms more than twice as often as women:

The problem with hook up culture, then, is not that people are friends with benefits.  It’s that they’re not. As one of my students concluded about one of her hook up partners:  “You could have labeled it friends with benefits… without the friendship maybe?”

Hook up culture is an “engine of female progress” only if we take-for-granted that our destination is a caricature of male sexuality, one in which sex is a game with a winner and a loser.   But do we really want sex to be competitive?   Is “keep[ing] pace with the boys,” as Rosin puts it, really what liberation looks like?  I think we can do better.

Lisa Wade, PhD is an Associate Professor at Tulane University. She is the author of American Hookup, a book about college sexual culture; a textbook about gender; and a forthcoming introductory text: Terrible Magnificent Sociology. You can follow her on Twitter and Instagram.

Scholars are busy attempting to predict the effects of climate change, including how it might harm people in some parts of the globe more than others.  A recent report by The Pacific Institute, sent in by Aneesa D., does a more fine-grained analysis, showing which Californians will be the most harmed by climate change.

They use a variety of measures for each Census tract to make a Vulnerability Index, including natural factors (like tree cover), demographic factors (like age), and economic factors (like income).  At the interactive map, you can see the details for each Census tract.  Their compiled index looks like this:

You can also see the Vulnerability Index for each measure individually.  Here is the data for the percent of people over age 65 who live alone, a variable we know increases the risk of death from heat wave.

And here’s the data for the percent of workers who labor outside:

There’s lots more data at the site, but what’s interesting here is that, even in incredibly wealthy parts of the world, climate change is going to have uneven effects.  When it does, the most vulnerable people in the more vulnerable parts of the state are going to migrate to the other parts.  Most Californians don’t imagine that their cities will be home to refugees, but this is exactly what will happen as parts of California become increasingly difficult to live in.

Lisa Wade, PhD is an Associate Professor at Tulane University. She is the author of American Hookup, a book about college sexual culture; a textbook about gender; and a forthcoming introductory text: Terrible Magnificent Sociology. You can follow her on Twitter and Instagram.

Earlier this summer, Lisa posted about total student loan debt in the U.S., which has increased overall as more people go to college. “Student Lending’s Failing Grade,” a report from Moody’s Analytics  provides more information about student loan debt. Demand for student loans continues to increase as the number of high school graduates who go on to college rises. Over 40% now attend (blue line; the right axis shows percents):

Enrollment at for-profit institutions such as University of Phoenix is still a small minority of all those going to college, but it’s growing rapidly:

This is significant for student loan debt because students at for-profit (or proprietary) institutions have much higher default rates than students at private or public colleges:

However, the report points out that default and delinquency rates on student loans are quite low compared to other forms of debt. This is partially due to the consequences of defaulting, but also because it’s easier to defer student loan repayment and thus avoid being labeled as “defaulting” than it is for most other loans.

Overall, the report argues that projections of future student loan debt are worrisome. Loans taken out more recently have higher default rates than in the past, and students may have unrealistic expectations of how much they will make after graduation, and so overestimate how much they’ll be able to pay in student loan debt each month. From my experience watching students, I would add that it’s not even that they overestimate how much they’ll be able to afford; many don’t have a clear sense of how much their monthly payment will be, especially since they take out loans on a semester-by-semester basis and may not really think about the cumulative debt they’re taking on. Many are then shocked to discover that their monthly bill isn’t the insignificant sum they’d assumed it would be.

Way back in January, Dolores R. sent us a link to an illustration of how not to integrate social studies into the math curriculum, posted at SocialisTexan. Apparently some teachers in Gwinnett County, Georgia, thought it would be good to have some math word problems that connected to lessons from social studies, including racial history and slavery. One of them wrote some questions, which nine different 3rd-grade teachers approved; when the issue came to light, four had distributed them as part of a homework assignment. Parents complained upon seeing the questions, which many felt were inappropriate. For example, some questions asked students to calculate how much cotton or oranges slaves would pick, while another asked, “If Frederick got two beatings per day, how many beatings did he get in 1 week?”:

The teacher who created the questions later resigned and apologized. From all appearances, he really was trying to think of some way to connect different aspects of the curriculum. However, this chosen method was…very poorly thought out. The homework questions are insensitive, seeming to trivialize the violence of slavery rather than reinforce history lessons about it in a useful manner.

So how might topics from social studies, math, and other areas of the curriculum be integrated in a useful way? Sylvia Glauster, a middle school math teacher at The Ancona School in Chicago, emailed us about one example that I think connects discussions of racial history to math in a much more constructive manner.

Sylvia said that she often uses Soc Images posts to spark discussion among students, and that some of her students became particularly interested in racist images, including those in a post Lisa wrote several months ago about the historical meanings behind images of African Americans with watermelons: “Initially, they were not sure why some of the pictures could be viewed as racist, and hypothesized that their friends might also miss the connections that the blog post explains.”

So they got busy and developed a study to investigate further. Two students — 5th-grader Morgan and 6th-grader Sara (whose parents gave permission for their names to be used here) — chose five images and surveyed a random sample of 34 other students to see how many found the images racist. The students explain:

We started out by making a survey chart and getting pictures that we thought were racist.  Next, we surveyed people anonymously.  With all our data that we collected we made pie charts [for African Americans, Whites, and Other race/ethnicities].

The students had two hypotheses:

Before we started the survey we thought that the African American people would have more yes’s because they might have had similar racial experiences.  Most of the pictures are targeted at African Americans. We also thought that the 7th and 8th graders would say yes [they are racist] to more of the pictures because they are older than the 5th and 6th graders [and have had more experience].

The overall results:

The students had a good introduction to the research process. While one of their hypotheses was upheld, the other wasn’t:

We found that the 7th and 8th graders said yes to more of the pics.  Our hypothesis was right.  But our hypothesis for the African Americans was wrong.  The Caucasians said yes to more of the pics.

Interestingly, Sylvia says that “students were least likely to find the caricature of Jafar [from Aladdin] racist, which my students think is probably because our culture is more aware of racism against African Americans.”

This, I think, is a more thoughtful cross-curricular activity. It doesn’t just shoehorn some references to slavery or racial history into a math problem in a superficial way. Students thought critically about the topic and the larger social and historical context, all while practicing important skills in math and statistical analysis.

I’m sure that guiding students through a project of this sort takes significantly more planning and effort than writing the word problems did. But that’s part of the point: if you want to help students understand our complicated racial/ethnic history, as well as how race operates in our society today, you can’t do it on the cheap. It takes careful thought and a lot of preparatory work by the instructor to create activities and materials that foster critical thinking in a sensitive, appropriate way. Kudos to Sylvia for providing a good example, and to Sara and Morgan for doing such a nice job on their project!