education

How does the U.S. compare to other developed countries on measures of social justice? According to the New York Times, not very well.  The visual below compares countries’ poverty rates, poverty prevention measures, income inequality, spending on pre-primary education, and citizen health.  The “overall” rating is on the far left and the U.S. ranks 27th out of 31.


Via Feministing.  See also how the U.S. ranks on measures of equality and prosperity(33 out of 33, for what it’s worth). Thanks to Dolores R. for the link!

Lisa Wade, PhD is an Associate Professor at Tulane University. She is the author of American Hookup, a book about college sexual culture; a textbook about gender; and a forthcoming introductory text: Terrible Magnificent Sociology. You can follow her on Twitter and Instagram.

Cross-posted at Citings and Sightings.

In an interview discussing whether teen sleepovers can actually prevent teen pregnancy, CNN’s Ali Velshi says flatly, “This is a little bit counter-intuitive.” But as his interviewee, UMass sociologist Amy Schalet (who wrote on this subject in Contexts in “Sex, Love, and Autonomy in the Teenage Sleepover” in the Summer of 2010), explains:

Let me clarify: it’s not a situation where everything goes… It’s definitely older teenage couples who have established relationships and whose parents have talked about contraception.

Which is to say, as Velshi puts it, sex and sex education in countries like the Netherlands, in which parents are more permissive—or as Schalet says, “parents are more connected with their kids”—about allowing boyfriends and girlfriends to sleep over, take “a holistic approach.”

Schalet’s research, explored more deeply in her new University of Chicago book Not Under My Roof, takes a look at American parenting practices surrounding teen sex and the practices of parents in other countries. Using in-depth interviews with parents and teens and a host of other data, she finds:

The takeaway for American parents… isn’t necessarily “You must permit sleepovers.” Many parents are going to say, “Not under my roof!” That’s why it’s the title of my book. The takeaway is that you can have more open conversations—you should probably have more open conversations—about what’s a good relationship, sex and contraception should go together, what does it mean to be “ready,” how to get rid of some of these damaging stereotypes (gender stereotypes). Those are all things that are going to help promote teenage health and better relationships between parents and kids.

Schalet is clear that parental approaches are nowhere near the only factor in the stark differences in teen pregnancy rates between the U.S. and the Netherlands, but says they are, in fact, particularly important. “Kids are having sex, clearly,” Velshi says. And that’s precisely the point, no matter whether parents believe their kids should be able to have sex in their own homes, Schalet believes: “I think what you emphasize is that, above all, the conversation is important, and the conversation itself does not make kids have sex.” Ideally, she points out, that conversation will take place at home with parents, but a holistic talk about sexuality, relationships, and health can also take place in schools, with clergy, and in many other locations.

Dr. Schalet on CNN (we apologize for the commercial):

Amy Schalet’s new book is Not Under My Roof: Parents, Teens, and the Culture of Sex.

—————————

Letta Page is the Associate Editor and Producer of The Society Pages. She has a decade of experience in academic editing across a range of disciplines, including two years as the managing editor of Contexts. Page holds degrees in history and classical studies from Boston University and an art degree from the University of Minnesota.

If you would like to write a post for Sociological Images, please see our Guidelines for Guest Bloggers.

Cross-posted at Reports from the Economic Front.

Here is a short (less than 4 minute) video that illustrates the fact that 53% of our tax dollars, conservatively estimated, go to finance our military.

And here is a link to a recent study by Robert Pollin and Heidi Garrett-Peltier on the employment effects of military spending versus alternative domestic spending priorities, in particular investments in clean energy, health care, and education.

The authors first examine the employment effects of spending $1 billion on the military versus spending the same amount on clean energy, health care, education or tax cuts.  The chart below shows their results.

defense.jpg

Moreover, even though jobs in the military provide the highest levels of compensation, the authors still find that “investments in clean energy, health care and education create a much larger number of jobs across all pay ranges, including mid-range jobs (paying between $32,000 and $64,000) and high paying jobs (paying over $64,000).”

Let’s see if these facts come up in the next Congressional budget debate.

For the last week of December, we’re re-posting some of our favorite posts from 2011.

————————

Flickr creative commons by Sakurako Kitsa, Roberto De Vido, and Stella Hwang.

In her article “Japanese Mothers and Obentos: The Lunch-Box as Ideological State Apparatus,” Anne Allison discussed the meaning of obentos. The Japanese educational system is highly centralized, with the national Ministry of Education determining the curriculum and approving textbooks. Nursery school, though overseen by the Ministry, is generally private and isn’t compulsory, though attendance is high. According to Allison, it functions much like kindergarten in the U.S., focusing less on content than on how to be a student. Of particular importance are the ability to transition from home life to the public sphere of a bureaucratic state institution and socialization into norms of group life, including cooperation and emphasis on the collective rather than the individual.

The obento was seen as an important element of this process. It was a token of home, and more specifically, of mom. The willingness to make elaborate, creative obentos was used as a measure of a woman’s commitment to the mothering role. The lunches, as you can imagine from the photos, could be very time- and labor-intensive to make. During her time in Japan, Allison says she and the mothers she talked to spent 20-45 minutes each morning on a single obento, in addition to the time spent planning and shopping for ingredients. Tips for making obentos were a frequent topic of conversation among moms, and whole magazines were devoted to the topic. Stores sell a range of obento items, including containers, decorations, molds and stamps to cut foods into various shapes, and, increasingly, pre-made food:

Nursery schools carefully oversaw lunch. The entire obento must be eaten, and everyone had to wait until every child had finished — an important lesson in the importance of the group over the individual. Thus, part of the mother’s job was to make the food appealing and easy to consume, in an effort to encourage her child to eat and avoid the embarrassment of holding up the rest of the class from after-lunch recess. Making food brightly-colored, in various shapes, and in small portions helped with this process. If a child failed to eat the entire lunch, or ate slowly, both the child and mother were held accountable. More than just a lunch, then, Allison argues that obentos served as a form of socialization into ideas of what it meant to be Japanese, particularly the emphasis on the collective and the importance of meeting expectations. Indeed, her son’s teacher viewed him as successfully assimilating to Japan not when he learned the language or made friends, but when he began routinely finishing his obento.

Talking to Japanese mothers — and making obentos for her own young son — Allison found that designing obentos was often viewed as a creative outlet, a way to express themselves and their love for their child. The small group she spoke with generally described it as a fulfilling part of motherhood. But the stakes were also high, since making a sub-par or merely utilitarian obento could stigmatize them as bad mothers. The quality of a mother’s obento became a symbol of the quality of her mothering and her commitment to her child’s educational success.

Of course, this served to institutionalize a form of intensive mothering that is difficult to balance with work life or outside interests. The women she spoke to generally could not hold even part-time jobs and fulfill the expectations placed upon them; those who did often tried to keep it secret to avoid negative judgment from their child’s teacher. In fact, a 2007 Japan Today article said that 70% of Japanese women leave the paid labor force when they have a child.

Allison’s article was published in 1991. I’d love to hear from readers with more recent experiences with expectations surrounding obentos in Japan.

UPDATE: As I had hoped, some of our readers have some great insights about obentos, including questioning whether the really elaborate obentos are most common among wealthier families while most make do with less intricate versions that don’t require as much commitment to intensive mothering. Be sure and check out the comments!

[Full cite: Anne Allison. 1991. “Japanese Mothers and Obentos: The Lunch-Box as Ideological State Apparatus.” Anthropological Quarterly 64(4): 195-208.]

Gwen Sharp is an associate professor of sociology at Nevada State College. You can follow her on Twitter at @gwensharpnv.

For the last week of December, we’re re-posting some of our favorite posts from 2011. Originally cross-posted at Ms.

————————

The New York Times has a fascinating 3-minute video on “roster management”, sent in by Emma M.H.  The term refers to manipulating Title IX rules in order to appear like you’re following them when you’re not.  Title IX is an amendment to the U.S. Civil Rights Act that requires that all schools allocate their resources to men and women in proportion to their interest and enrollment.  It is most famous for what it required of college athletics, and this is what this story is about.

As the article explains, schools demonstrate compliance with Title IX:

…by showing that the number of female athletes is in proportion to overall female enrollment, by demonstrating a history of expanding opportunities for women, or by proving that they are meeting the athletic interests and abilities of their female students.

Once implemented, women responded enthusiastically to the new opportunities.  But spectators and donors are less interested in women’s sports, it turns out.  And so colleges have found various ways to resist Title IX rules, including simple non-compliance.

In this case, the strategy is  to put men on women’s teams and then report them as female athletes.

Case in point: This is Cornell’s women’s fencing team:

It turns out, 15 of the 34 team members are men:

The men don’t actually compete, they are simply “practice players” (helping the women improve due to their greater speed and strength, says the coach).

The basketball team has a similar strategy.  A number of males practice with the team and then are reported to the authorities as female players.

Revealing that this is an attempt to manipulate Title IX rules and not a simple weird way of accounting for athletes, the five female coxswain’s on the men’s rowing team is reported not as male, but as female.

So there you have it.  Despite Title IX, these schools are finding ways to continue to spend a disproportionate amount of money on male athletes.  According to the Department of Education, this is well within the law.

Other sneaky moves documented in the article:

Quinnipiac University in Connecticut had violated Title IX by engaging in several questionable practices, including requiring that women cross-country runners join the indoor and outdoor track teams so they could be counted three times. The judge found earlier that Quinnipiac had been padding women’s rosters by counting players, then cutting them a few weeks later.

At the University of South Florida, more than half of the 71 women on the cross-country roster failed to run a race in 2009. Asked about it, a few laughed and said they did not know they were on the team.

Sarah Till, who graduated from South Florida in 2009, was a more extreme case. She said that she quit and returned her track scholarship in her sophomore year, but her name was listed on the rosters of all three squads through her junior year.

The University of California, Irvine, is among at least five California universities that sponsor women’s indoor track teams despite a mild climate and a dearth of indoor facilities. Those universities do not offer men’s indoor track.

Last year, an investigation by the Office for Civil Rights concluded that Irvine was not complying with Title IX because its indoor track team was essentially a ruse. It competed in just one meet per year and several women on the roster “vigorously stated” that they were not on the team.

Read the article and watch the video here.

Lisa Wade, PhD is an Associate Professor at Tulane University. She is the author of American Hookup, a book about college sexual culture; a textbook about gender; and a forthcoming introductory text: Terrible Magnificent Sociology. You can follow her on Twitter and Instagram.

With the college football championship games coming up, Dmitriy T.M. thought it was a good time to highlight the NCAA’s database that provides detailed information on graduation rates of college athletes. For each school, you can select particular sports and years. I decided to look up graduation rates for 2010-2011 at the two schools I attended: University of Oklahoma (undergrad) and University of Wisconsin-Madison (grad school).

The database reports two numbers. The Federal Graduation Rate (FGR) reports numbers for individuals who were first-time college students when they enrolled at the institution (that is, no transfer students are included, and students who transfer count negatively in the rate for their initial school, the equivalent of a drop-out); the FGR indicates how many students graduated from their initial institution within 6 years. The Graduation Success Rate (GSR) takes into account transfer students; as long as they’re in good academic standing when they transfer, they aren’t counted against the initial school’s graduation rate.

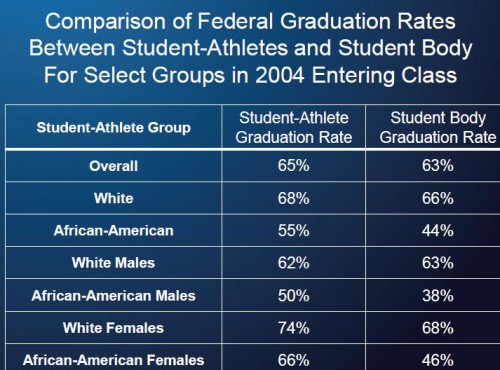
So how are student athletes doing? According to the NCAA’s analysis, if we look at the  more restrictive FGR for students who began college in 2004, student athletes actually have higher graduation rates in general, especially for African Americans:

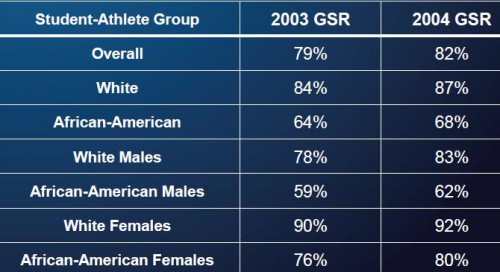
If we switch to looking at the GSR (which, again, drops transfers from the data for the initial school, rather than counting them as non-graduates), for students who began college in 2003 and 2004, overall graduation was pretty high (79 and 82 percent), but we see pretty wide disparities. White student athletes were significantly more likely to graduate than African Americans, and for both races, women were more likely to graduate than men:

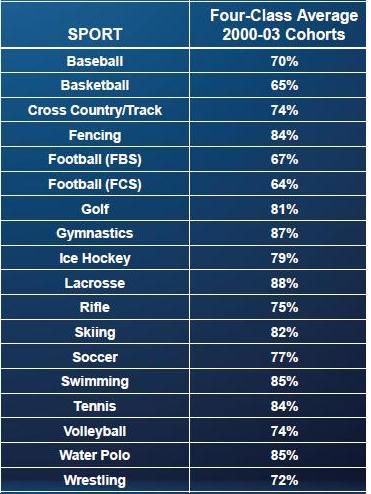
Graduation rates also vary by sport. Here are the averages for male athletes who enrolled between 2000 and 2003; we see basketball and football at the lower end, while lacrosse graduated 88% of its players from that period (the two football #s refer to the different divisions):


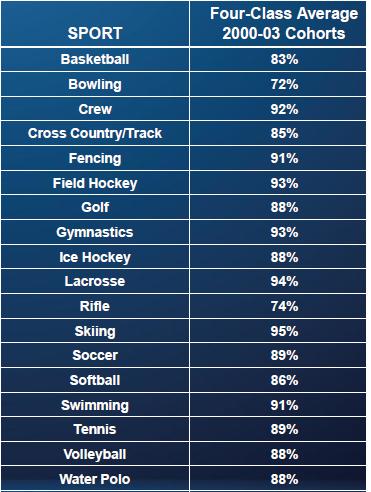
Female athletes from the same cohorts; the only sport where they didn’t have (usually significantly) higher graduation rates than men playing the same sport is rifle:

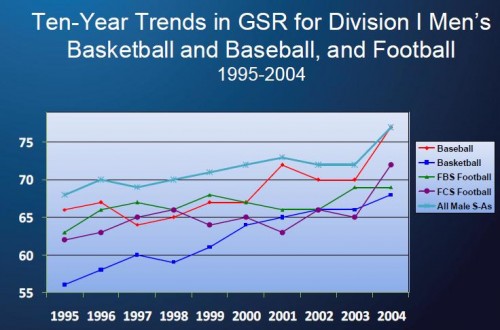
Ten-year trends for men in Division I schools in the “big three” sports:

There’s lots more detailed info available if you click the “Trends in Graduation Success Rates and Federal Graduation Rates at NCAA Division I Institutions” link at the top of the website; you can also get reports for particular schools broken down by sport, race/ethnicity, sex, etc.

Cross-posted at Jezebel.

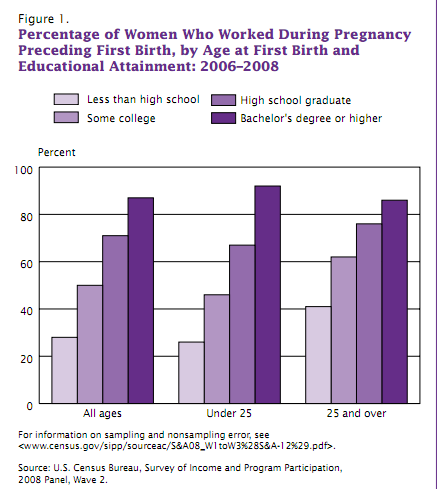
The U.S. Census Bureau recently released a report on employment and parental leave for first-time mothers. The mean age at first birth is now 25 years. And while a few decades ago the norm was for women to quit work upon getting pregnant, from 2006 to 2008, 56.1% of women worked full time during their pregnancy, leaving work only as the due date approaches. However, this varies widely by educational level, largely because women with the lowest levels of education are less likely to be working regardless:

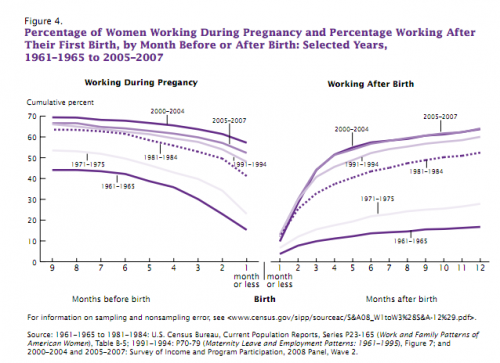
The graph on the left below shows how many months before the birth working women left their work; the graph on the left shows how many months after the birth they returned. As we see, over time women have stayed at their paid jobs longer and returned more quickly:

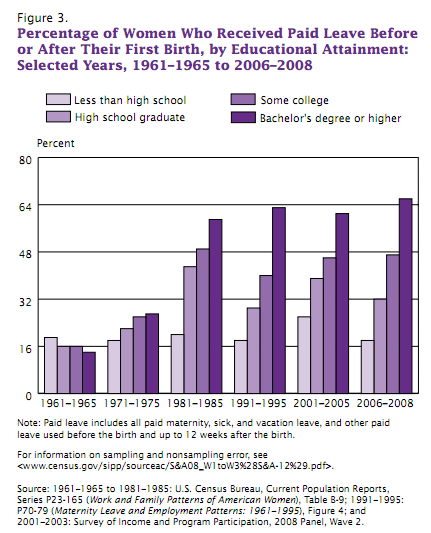
During the 2006-2008 reporting period, for the first time a majority — but a bare one, at 50.8% — of first-time mothers in the labor force used paid leave (maternity leave, sick days, etc.). Not surprisingly, access to paid leave also varied greatly by educational level, and that gap has widened significantly over time:

So nearly half of first-time mothers in the U.S. still do not have paid leave from their jobs.

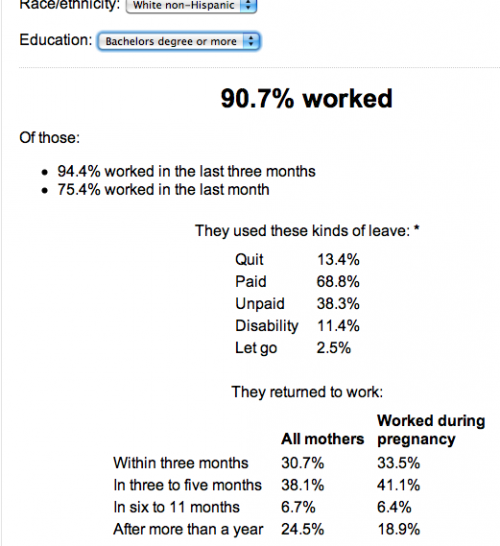
PBS created an interactive program based on the data that allows you to see the patterns more clearly. You select a race/ethnicity and educational level and get a detailed breakdown of the data. For instance, here’s the info for White non-Hispanic women with a 4-year college degree or higher:


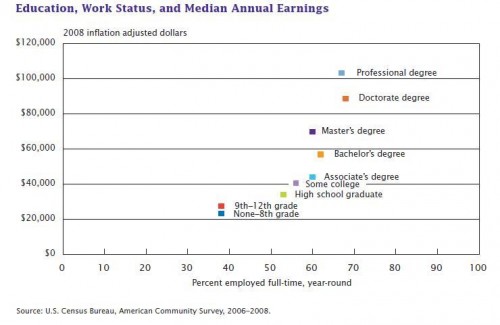
The Census Bureau posted some information about the economic payoff of a college degree on their blog, Random Samplings. A recent report indicated that educational level had a bigger impact than any other demographic factor on lifetime earnings. More education leads to both higher incomes not just because those with more education receive higher salaries, but also because they are more likely to be in full-time jobs. The x-axis here shows the % of people in full-time, year-round jobs:

Not surprisingly, the gap in earnings widens over time, especially for those with a bachelor’s or higher degree compared to those with less:

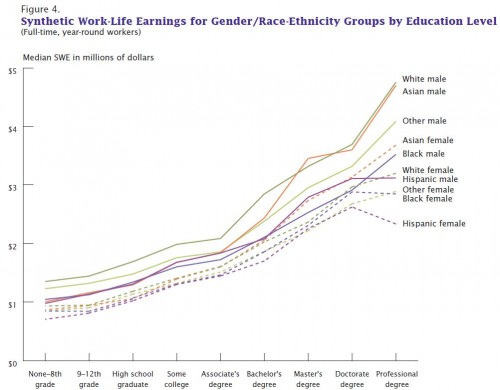
The report also estimated lifetime earnings by race/ethnicity for men and women separately. As they point out, except for a couple of cases at the very highest educational levels, men from even the most economically disadvantaged racial/ethnic groups out-earn women from the most economically advantaged ones:

Of course, not all college degrees are equal. Dolores R. sent in a link to an interactive table from the Wall Street Journal that lets you look at earnings and the unemployment rate for various majors. I sorted them by median earnings; here are the ten with the lowest median earnings:


And the ten with the highest:

The highest unemployment rate? Clinical psychology, at 19.5%.

You can also search by area (art, engineering, etc.), though it looks like the categorization may be a little sketchy — for instance, “geology and earth science” and “liberal arts” show up under the arts.

For more on college majors, earnings, and future career opportunities, see the report College Clusters: Forecasting Demand for High School through College Jobs, 2008-2018, from the Georgetown University Center on Education and the Workforce.