
Cross-posted from Family Inequality.
The Congressional Budget Office has a new report on trends in the income distribution. The big news is the 1%’s blitzkrieg assault on equality.*
The headline image will be this one, which shows the changing share of after-tax-and-transfer household income. Every group except the top 1% had a smaller share of income in 2007 than they did in 1979, or just an equal share in the case of the 81st-99th percentile group. That means the gains in the top quintile are all concentrated in the top 1%.

That is very important and a source of outrage for the hundreds of thousands of Facebook users posting, commenting, or “liking” Occupy Wall St. and its related pages.
But it would be misleading to view the chart as showing that incomes fell for the other groups, since it shows shares of the total income. Income growth has been very skewed toward the top, but it is by no means confined to the top 1%. Here is my graph showing the income cutoffs for each quintile, and for the top slices separately. These are the cutoffs in 1979 and 2007 (in inflation-adjusted dollars), with the percentage change in the backgrounded bars.
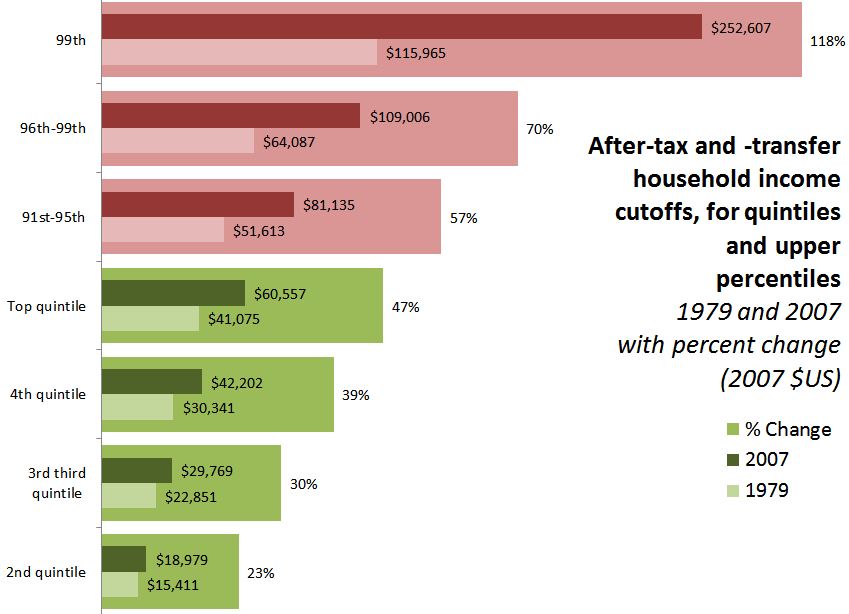
(Note there is no lower cutoff for the bottom quintile — the price of entry for that group is always $0).
Two thoughts about this.
- Even if there were no 1%, if the graph only included the green bars, there would be plenty of increasing inequality for what might then be called “the 80%” to protest. The 81st-99th folks may be lucky to have the popular anger directed at the grotesque opulence of the sliver above them. (I’m not diminishing the extremity of the gains for the top 1%, but, as Matt Taibbi describes, the object of opposition is not just their income, but their influence.
- If you look at the families and networks of the top 1%, how many of them have relatives, friends, and even co-“workers” who are only in the top 10%? Would a self-respecting 1% family be appalled if their son married someone from a stable 5%-er family?
What I’m wondering is whether the 1% folks are merely a statistical convenience rather than a socially cohesive group (dare I say, class?). That’s an empirical question that national income distributions can’t necessarily answer.
*I should mention that the report is not just another rehash of Census numbers, though. Two adjustments they made seem especially good. First, they used a tricky matching method to combine Current Population Survey numbers (which do better at benefits and low-income households) combined with Internal Revenue Service data (which is better for high-end data). Second, they adjusted for household size and composition, and calculated distributions before and after taxes and transfers, and among different kinds of income. The report is here, a summary is here, and the blog post version is here.
Comments 11
Yrro Simyarin — November 3, 2011
I'm glad that people are finally showing this graph. Which proves, among other things, that the middle class has not been "stagnating", as it is often put. It is demonstrably better off than it was 30 years ago, even ignoring the benefits of technological improvements and Walmart. The fact that we have not sustained one of the highest growth rates in the history of the country (ie, the post-war boom, which followed a depression) should not *really* be that surprising.
Now, the next step of the analysis is to try to find comparative countries and see how *their* middle and lower classes grew.
Because the base argument of the OWS crowd is not that the 1% grew faster than the 99%, but that it grew faster *at the expense* of the 99%. Simply showing that the 1% grew faster than the 1%'s in other countries (which is what GINI shows) is necessary to prove their that, but not sufficient.
Mordicai — November 3, 2011
I think that yeah, the 99/1 division is one of convenience & not a true class boundary. The 19% is fine, but I mean, splitting that 1% up is important, too. I mean, it isn't anomalies like Justin Bieber-- who is in the 1% but isn't like, a contributing factor to the housing bubble, bundled loans, or government lobbying, you know?
SamLL — November 3, 2011
Another helpful image, this one from Paul Krugman's blog.
Anonymous — November 3, 2011
One thing to keep in mind here - Weath distribution in the US follows a Power Law distribution. One feature of Power Law curves is Scale Invariance. Basically, what that means is that no matter how we look at the curve - chop off the top x%, zoom in, etc, we're ALWAYS going to see the same amount of inequity - it'll just start at a lower amount.
The only limiting factor is the baseline cost of living. Once you have that covered everything else is gravy.
Bob — November 3, 2011
Wealth and income are two very different things.
[links] Link salad has got your number | jlake.com — November 29, 2011
[...] Does the 1% Distract from the Next 19? [...]
lawyerlady — December 19, 2011
The 1% is certainly a statistical convenience more than anything else! The truth is, only a small fraction of the 1% is what most middle class people would consider "rich". The majority of the 1% is comprised of doctors, dentists, lawyers, and small business owners who, while generally enjoying the perks of safe neighborhoods, quality schools, etc., are hardly spending their time yacht shopping and skiing Aspen. When considering if there is really a huge difference between the 1% and the 5%, just ask yourself if life is terribly different for your dentist and the average sociology professor:)