economics: great recession

The desperate economic situation of Detroit, Michigan is in the headlines these days.  From the New York Times:

In one sign of distress, in the first nine months of this year [2008], some 130,000 Michigan residents who had lost their jobs remained out of work so long that they ran out of regular unemployment benefits. By the middle of this month, 63,000 people (who had already run out of their ordinary maximum benefit — as many as 26 weeks, at as much as $362 a week) also ran out of an extension authorized by Congress.

This figure shows the unemployment and forclosure rate in Michigan as of Oct. 2008.  It shows that Michigan in general, and Detroit especially, is doing much worse than the national average:

23michigan_graphic_correx

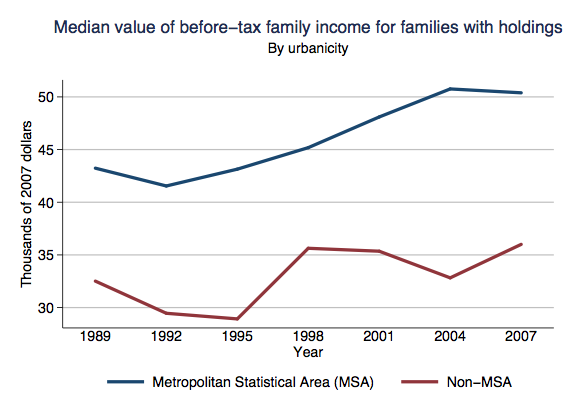
Today’s numbers reflect not just the current recession, but 30 years of decline.  A figure from Spiegel reveals that the marketshare of U.S. automakers have been steadily dwindling:

01020139856300

Spiegel reports that the city has lost more than half its inhabitants since the 1950s (from close to 2 million, to 917,000 in 2009).  The tax base has plummeted and city services, in turn, have been cut.

The conditions in Detroit are dire, and they contrast greatly with the city in the late 1800s and early 1900s.  Then, Detroit’s shipping and manufacturing economy, innovative for its time, made it a rich and vibrant city.  Today, the ruins of that vibrancy still occupy the city.

Detroit’s main train station, opened in 1913 has not been used since 1988:

reliques_01

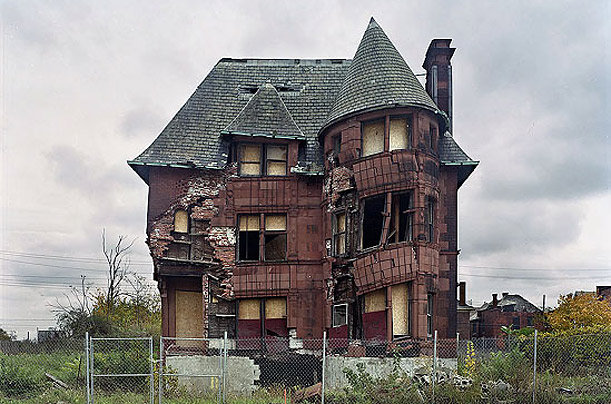
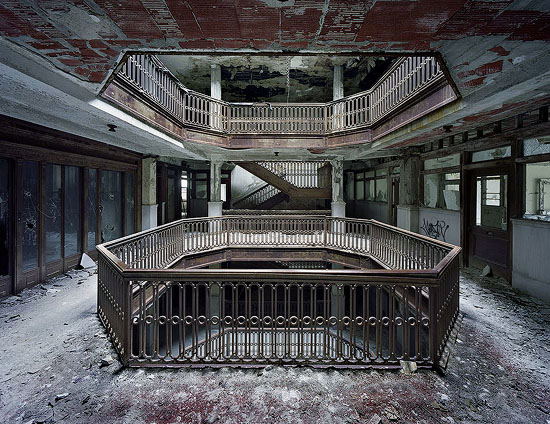
Constructed in 1893 in the once-elegant Brush Park neighborhood, this home, designed by architect Albert Kahn, was moved from its original location several years ago by preservationists who hoped to preserve it. It was demolished last year:

reliques_02

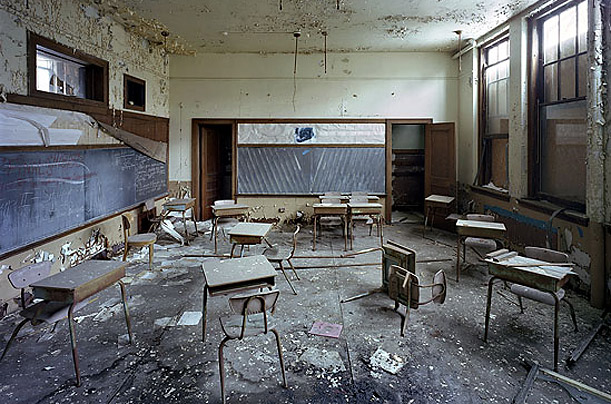
Many of the city’s Catholic schools have been closed, though the churches they are affiliated with remain active:

reliques_03

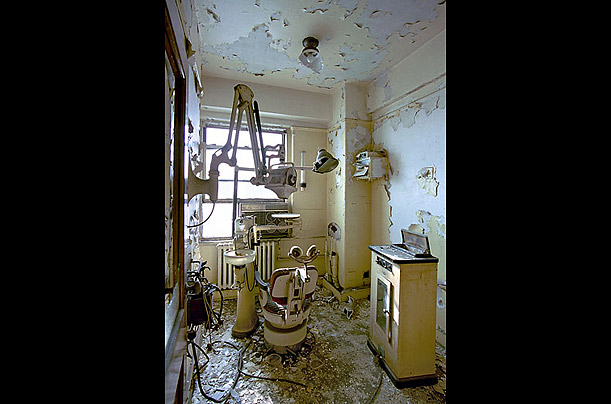
One of the city’s most prominent skyscrapers, this 35-story tower once housed the offices of many doctors, lawyers and dentists. It has been virtually empty since the 1980s. Developers hope to convert the building to residential units by 2010:

reliques_04

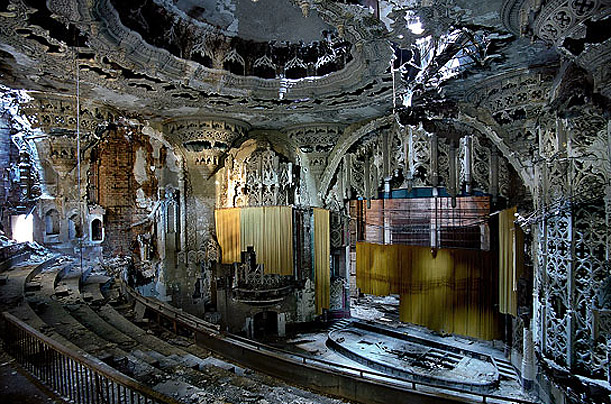
This spectacular Spanish Gothic theater, built in 1928, was closed in the 1970s:

reliques_05

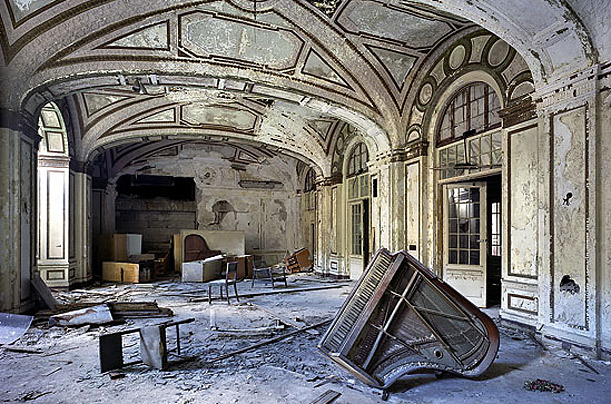
Once one of the most luxurious residential hotels in Detroit, Lee Plaza closed in the 1990s:

reliques_07

The Farwell Building:

farwell1

Photographers Yves Marchand and Romain Meffre write: Detroit’s “splendid decaying monuments are, no less than the Pyramids of Egypt, the Coliseum of Rome, or the Acropolis in Athens, remnants of the passing of a great civilization.”

Images first found here.

stimulus_large

(Found here, via Thick Culture.)

Nate Silver at FiveThirtyEight put up this graph of U.S. household debt (from the 2007 Survey of Consumer Finances):

debt2

Silver says,

Per-family household debt increased by about 130% in real dollars between 1989 and 2007, from roughly $42,000 per family in 1989 to $97,000 eighteen years later. Most of that increase has come during the past six or seven years — household debt increased by 52% between 2001 and 2007 alone. Almost all of the debt (about 85%) falls into the category that the Fed calls “secured by residential property” — which means mortgages and home-equity loans.

Some other images from the SCF Chartbook (available here)–and pay attention to the y axis, since the scale isn’t the same in all of them:

picture-16

picture-23

picture-3

picture-4

This next one is for rural (non-MSA) and urban (MSA) areas:

picture-5

picture-6

The Chartbook has images of the mean values for all these calculations as well, I just prefer the median to reduce the effects of outlier incomes.

In the wake of the embarassing incident where car company executives were called out for flying in private jets to beg Congress for money, Cessna, manufacturer of private jets, is fighting back.  At their new website, www.cessnarise.com, they’re framing the attack as skeptical hyperbole that doesn’t take into account the facts and recommending that potential purchasers of private jets “rise” above it all.  Some screenshots:

capture9

Notice that Cessna frames the resistance to private-jet-flying chastisement as a “challenge” that should be overcome.

capture11

I don’t know whether private jet ownership is, in fact, economically smart.  I am rather sure that it depends on the company/person.  I do, however, think it’s interesting the way that Cessna is framing a rejection of the point made by Congress (that it is, perhaps, indulgent to insist upon private jet travel) in moral terms.  Customers should “rise” above, take on the “challenge,” fight the “naysayers,” beat the “skeptics.”    Real economics, then, appear to take a backseat to resisting the accusation that some of us enjoy extreme class privilege that is not necessarily justified by the books.

Larry H. (of the L.A. TimesDaily Mirror blog) sent in a link to an interactive map at the NYT that shows December 2008 unemployment rates by county. Here’s a screenshot:

picture-11

If you go to the link you can hover over counties and get their individual unemployment rates.You can also filter by manufacturing counties, rural counties, and counties that experienced a housing boom, as well as the 1-year change in unemployment rate.

Of course, you might want to combine this with a discussion of how unemployment is calculated–the 7.6% is most likely what is called the U3 rate, which is always lower than the more comprehensive U6. If we look not just at unemployment but at underemployment–people who can’t get enough hours to support themselves–and people who have given up looking for work, the rate would be higher.

Burk and Paul I.-M. both sent me this video that sums up the current credit crisis:

[youtube]https://www.youtube.com/watch?v=w4gcdQA33aI[/youtube]

It’s helpful for understanding the situation, but I can’t help pointing out a few issues, like the gendering–almost all the bankers, investors, brokers, and other members of the financial systems are male (I believe one of the investors was female). Also, I found the image of families interesting: “responsible” families are thin and have one kid while irresponsible ones smoke, drink, get fat, and have tons of kids.

Also, it didn’t explain too much about the types of loans made available to the subprime market, particularly the fact that monthly payments often went up significantly after a couple of years, so you might want to throw that in if you show the video–it wasn’t always that people got loans they couldn’t afford at the initial rate, it’s that when the interest rate changed and their payments increased, they couldn’t afford the higher rates. And of course many perfectly “responsible” families took subprime loans, planning on flipping the property for a nice profit, driving real estate prices up for everyone…and now often going into foreclosure along with everybody else.

Those caveats aside, it’s a pretty useful video for boiling down some basic causes behind the credit crisis.

NEW! (Mar. ’10): Caity sent in this video by Westpac, an Australian bank, in which they attempt to explain the credit crisis in a way that some have felt was self-serving and condescending. Caity explains,

Nearly all Australian home loans are on variable interest rates. Our reserve bank recently put up the national rate by 0.25%. Usually, the banks raise (or lower) their rates about in line with the reserve bank’s changes, but this time Westpac (one of our biggest banks) put theirs up by 0.45% – and then emailed this video to all of their home loan customers to explain why.


Gwen Sharp is an associate professor of sociology at Nevada State College. You can follow her on Twitter at @gwensharpnv.

Considering the graph below comparing the percent of GDP spent for economic stimulus during The Great Depression (1940s) and today (from the Tax Policy Center), Ezra Klein concludes:

We’re spending a lot right now, but this is hardly the most aggressive fiscal experiment in history.

federalspendingovertime

Contrast that summation with this ad from the American Issues Project:

[youtube]https://www.youtube.com/watch?v=eZ_Chroi4oc[/youtube]

This is what sociologists call a framing war.  Is the economic stimulus big or small?  You can make arguments either way, and people will.  The question is: Which frame will resonate more with (which members of) the American public?  We’ll have to wait and see.

(Via Alas A Blog.)

Lisa Wade, PhD is an Associate Professor at Tulane University. She is the author of American Hookup, a book about college sexual culture; a textbook about gender; and a forthcoming introductory text: Terrible Magnificent Sociology. You can follow her on Twitter and Instagram.

Nate Silver, over at FiveThirtyEight.com, points out that whereas sales of beer have generally been relatively unaffected by economic conditions, the current financial situation led to a rather dramatic decrease in beer sales in late 2008:

beer4

I don’t have any sociological point here. I just think it’s interesting, and since I thought so, I thought I’d make you look at it too. Nate Silver (who I have a bit of a geek crush on) hazards a few theories (in particular, perhaps people are substituting cheaper beers for more expensive ones, meaning they’re drinking as much or more, but spending less); it’s worth checking his post out.

As I said, absolutely no point to this post other than “Huh. Look at that.”