class

AGM, while perusing the U.S. Bureau of Labor Statistics website and discovered that the U.S. government has seen fit to illustrate various jobs with photographs.  The photographs reveal quite dramatic assumptions about who does what jobs.  I’ll let you be the judge as to what they are, in alphabetical order.

Authors:

Child care workers:

Cooks and Food Preparation Workers:

Dentists:

Dental Assistants:

Executives:

Personal Appearance Workers:

Physicians:

Physician and Medical Assistants (fixed):

Security Guards:

Sociologists!

AGM thought the picture of sociologists deserved the caption, “Sociologists have nothing but contempt for one other, both as scholars and as human beings.”

Lisa Wade, PhD is an Associate Professor at Tulane University. She is the author of American Hookup, a book about college sexual culture; a textbook about gender; and a forthcoming introductory text: Terrible Magnificent Sociology. You can follow her on Twitter and Instagram.

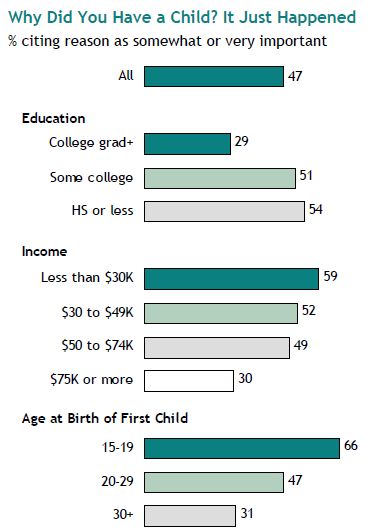
The Pew Research Center, in a report on American motherhood released this month, reported that 35% of people say that their first child “just happened.”

I think this is fascinating in light of the fact that many Americans are generally committed to the idea that we control our fertility.  Safe(r) sex and family planning campaigns tell us that, if we make the proper choices, then we will (very probably) not have an unplanned pregnancy.  They tend to downplay the fact that even the most effective methods of pregnancy prevention are not foolproof.  Let’s call this the ideology of near-perfect control of reproduction.

In fact, about half of all births occur as a result of an unplanned pregnancy.  So the fact that 1/3rd of parents say their first child “just happened” may actually be an under count.  An ideology of near-perfect control of reproduction, however, makes it seem really surprising that so many parents would choose that response.

Then again… maybe the ideology of near-perfect control of reproduction is a luxury afforded mostly to privileged classes.  The Pew report also offered data on who said that their first child “just happened”:

Notice that people with less education and lower incomes were more likely to have their first child by “accident” than people with more education and higher incomes.  They were also more likely to have their first child as a teenager.  These are the groups that we might expect, on average, to have less knowledge about birth control and less access to (especially more effective forms of) birth control.  Given that our society is class segregated, members of these groups may also be surrounded by other people who “just happened” to have kids.  The ideology of near-perfect control of reproduction, then, may not be as strong.  This may also contribute to a willingness to admit that it “just happened,” instead of re-fashioning the introduction of parenting as a fully conscious choice.

Hat tip to Philip Cohen at Family Inequality.

Lisa Wade, PhD is an Associate Professor at Tulane University. She is the author of American Hookup, a book about college sexual culture; a textbook about gender; and a forthcoming introductory text: Terrible Magnificent Sociology. You can follow her on Twitter and Instagram.

Jessica F. and Dmitriy T.M. alerted us to a really interesting photo project by Duncan McNicholl, a member of Engineers Without Borders Canada. Frustrated with the portrayals of “poor Africans” he saw at home in Canada, he decided to take pictures of his acquaintances in Malawi “dressed to kill” and “dressed very poorly.” He explains his motivation:

We’ve all seen it: the photo of a teary-eyed African child, dressed in rags, smothered in flies, with a look of desperation that the caption all too readily points out. Some organization has made a poster that tells you about the realities of poverty, what they are doing about it, and how your donation will change things.

I reacted very strongly to these kinds of photos when I returned from Africa in 2008. I compared these photos to my own memories of Malawian friends and felt lied to. How had these photos failed so spectacularly to capture the intelligence, the laughter, the resilience, and the capabilities of so many incredible people?

The truth is that the development sector, just like any other business, needs revenue to survive. Too frequently, this quest for funding uses these kind of dehumanizing images to draw pity, charity, and eventually donations from a largely unsuspecting public…

This is not to say that people do not struggle, far from it, but the photos I was seeing only told part of the story… [To contribute to correcting this,] I am taking two photos of the same person; one photo with the typical symbols of poverty (dejected look, ripped clothes, etc.), and another of this person looking their very finest, to show how an image can be carefully constructed to present the same person in very different ways.

McNicholl asked his acquaintances to participate and to choose their own clothes and pose as they like. Here are two examples of the result:

Lisa Wade, PhD is an Associate Professor at Tulane University. She is the author of American Hookup, a book about college sexual culture; a textbook about gender; and a forthcoming introductory text: Terrible Magnificent Sociology. You can follow her on Twitter and Instagram.

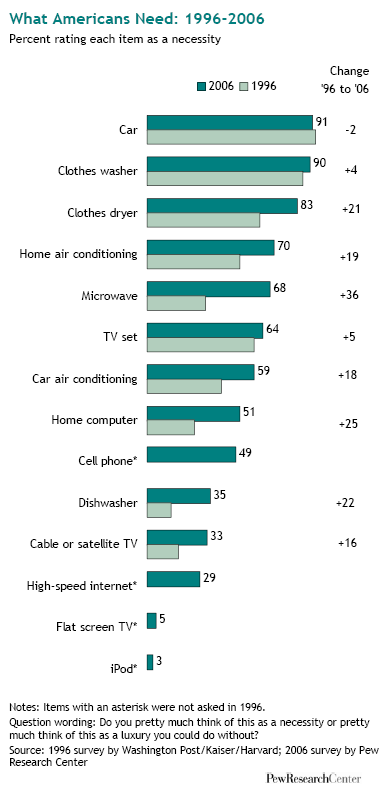
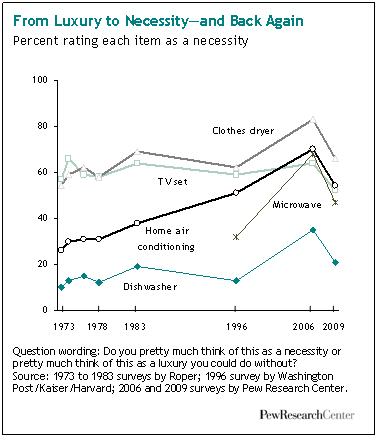
While I was at my grandma’s house this week I read Buying In: What We Buy and Who We Are, a fascinating book by Rob Walker. There will be more posts to come in the next few weeks, but for starters, I was struck by the results of a 2006 survey Walker mentions by the Pew Research Center. The survey asked people if various items were luxuries or necessities. Here are the results from 2006 and 1996:

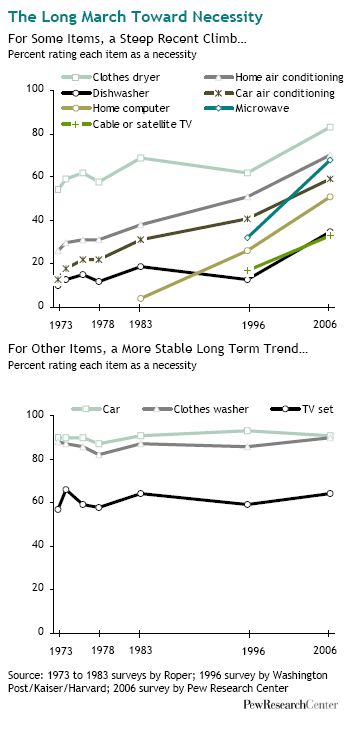
Clearly, over time we’re defining more and more items as necessities rather than luxuries:

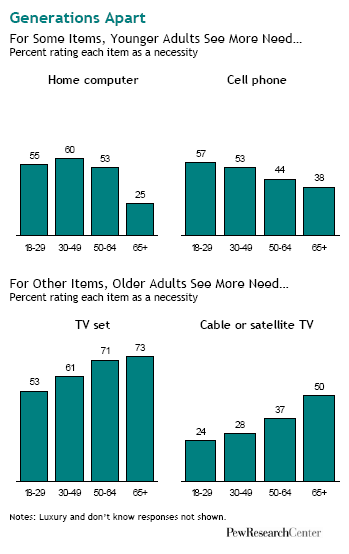
A breakdown of some results by age:

If I had to guess, I’d think the fact that younger people are less likely to say a TV is a necessity than older people is due not to less concern about TV but more willingness to watch content online. Does that seem reasonable? Other explanations?

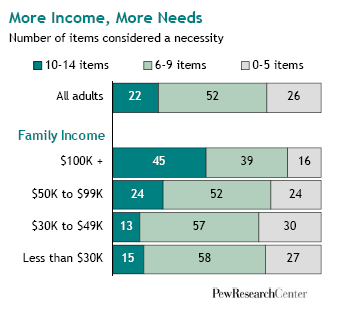
The survey found that the higher a person’s income, the more items they define as a necessity:

The biggest differences by income were for dishwashers, cell phones, computers, and high-speed internet, which are more likely to be defined as a necessity as income increases.

The Pew Center’s website has links to more detailed breakdowns, as well as full info on the question wording, methodology, etc. And as the authors say in the summary, the results show only a one-way change: in no case did they find that the overall percent defining something as a necessity decreased between 1996 and 2006. As they put it,

The old adage proclaims that “necessity is the mother of invention.” These findings serve as a reminder that the opposite is also true: invention is the mother of necessity. Throughout human history, from the wheel to the computer, previously unimaginable inventions have created their own demand, and eventually their own need.

The income data would seem to back this up: what we have, we often come to define as necessities.

I would love to see an international comparison of some sort. I’ll see what I can find.

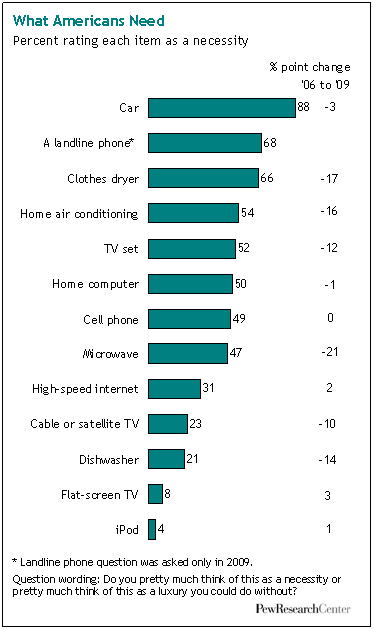
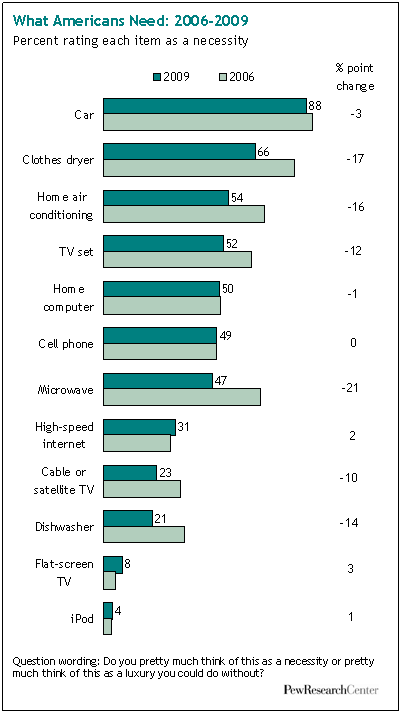
UPDATE: I haven’t found an international comparison yet, but I discovered that the Pew Research Center conducted the survey again in 2009 to see if attitudes had changed during the recession. Quite a striking change for several items:

d

In addition to differences in income, there is a persistent wealth gap between black and white families in the U.S. The term “wealth” refers to all of your assets (the home you own, money in savings and investments, etc) minus your debt. According to a new research and policy brief by Thomas Shapiro, Tatjana Meschede, and Laura Sullivan, the wealth gap has increased from $20,000 in 1984 to $95,000 in 2007.

The authors explain the growth in the gap this way:

The [increase in the] racial wealth gap… reflects public policies, such as tax cuts on investment income and inheritances which benefit the wealthiest, and redistribute wealth and opportunities. Tax deductions for home mortgages, retirement accounts, and college savings all disproportionately benefit higher income families.

There are also much variety in how much wealth is held by people within any given race. The figure below, shows that the gap between high-income and middle-income whites has tripled since 1984. Both groups, however, have seen an increase in the amount of wealth they hold.

In contrast, the wealth of middle-income black families has stagnated and the wealth of high-income black families has recently dropped, flattening differences in wealth among middle- and high-income blacks, but dramatically increasing the wealth gap between blacks and whites.

So why don’t we see an increase in the wealth gap among blacks? The authors point to “…the powerful role of persistent discrimination in housing, credit, and labor markets.”

For example, African-Americans and Hispanics were at least twice as likely to receive high-cost home mortgages as whites with similar incomes. These reckless high-cost loans unnecessarily impeded wealth building in minority communities and triggered the foreclosure crisis that is wiping out the largest source of wealth for minorities.

The authors conclude:

Public policies have and continue to play a major role in creating and sustaining the racial wealth gap, and they must play a role in closing it.

Hat tip to Philip Cohen, Family Inequality.

—————————

Lisa Wade is a professor of sociology at Occidental College. You can follow her on Twitter and Facebook.

What happens when huge numbers of people lose their homes?   Hundreds of thousands of Haitians lost their homes in the giant earthquake that struck Port-au-Prince in January.  Six months later, resource-poor and with little help from their government, they remain homeless.  When there are that many displaced people, where do they live?  Apparently, everywhere.  This week NPR reported that about 1,000 people are living in 326 make-shift structures on an 8-foot-wide median dividing one of Haiti’s busiest roads.

If private property is off-limits, public space fills up, and temporary housing isn’t provided, where are people to go?

—————————

Lisa Wade is a professor of sociology at Occidental College. You can follow her on Twitter and Facebook.

Lisa Wade, PhD is an Associate Professor at Tulane University. She is the author of American Hookup, a book about college sexual culture; a textbook about gender; and a forthcoming introductory text: Terrible Magnificent Sociology. You can follow her on Twitter and Instagram.

Keeping a trend in perspective.

The sociologist down the hall pointed out that yesterday’s chart gave the impression of a whopping increase in TANF (Temporary Assistance to Needy Families) support for poor families. But I have been complaining since December 2008 that the welfare system is not responding adequately to the recession’s effects on poor single mothers and their children. I wrote then:

We now appear headed back toward a national increase in TANF cases. But the restrictive rules on work requirements and time limits are keeping many families that need assistance out of the program…. If the government can extend unemployment benefits during the crisis, why not impose a moratorium on booting people from TANF?

So it does seem contradictory that I would post a chart yesterday showing a huge increase in TANF family recipients, and continue the same complaint. So let me put it in better perspective. It’s a good lesson for me on the principles of graphing data, which I have made a point of picking on others for.

Height and width

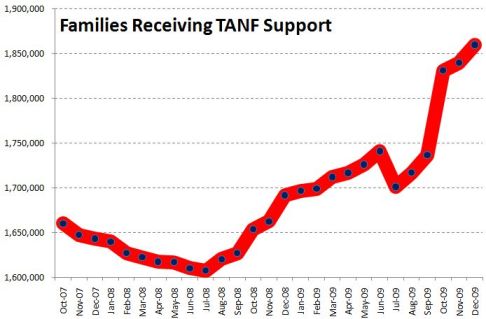
There were two problems with yesterday’s chart. First, the vertical scale only ran from 1.6 million to 1.9 million families. Second, the horizontal scale only ran for 26 months. I’ll correct each aspect in turn to show their effects. Here’s yesterday’s chart:

It sure looks like a dramatic turnaround. And any turnaround is a big deal. I wrote last year:

What should be striking in this is that the rolls are increasing even as the punitive program rules continue to pull aid from families according to the draconian term limits dreamed up by Gingrich, ratified by Clinton and endorsed by Obama — 2 years continuous, 5 years lifetime in the program. The current stimulus package includes more money for TANF, to help cover an expected growth in families applying — but no rule change to permit families to keep their support in the absence of available jobs.

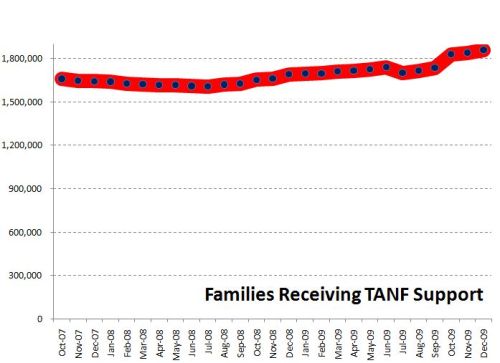
But, run the vertical axis down to zero, and the same trend is not so dramatic:

Now the big bounce since July 2008 is put in perspective. We’ve seen a 16% increase since that bottom point, but the response seems much more modest in light of the size and impact of the Great Recession we’ve come to know.

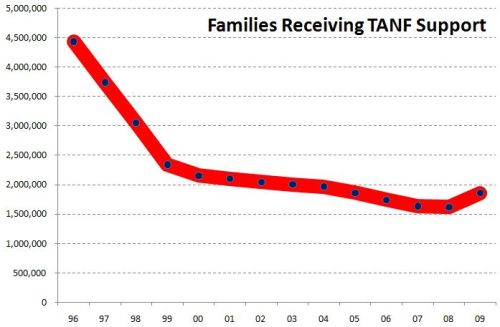
In fact, though, the longer-term view underscores how paltry that response has really been. Back the chart up to 1996, and you can see how small the increase has been compared with the pre-draconian reform period:

All three images are correct, but their emphasis is different. To me, the important take-home message from this trend is, “That’s it? The greatest economic recession since the Great Depression, and our welfare response was that measly uptick? Our system really is a shambles.”

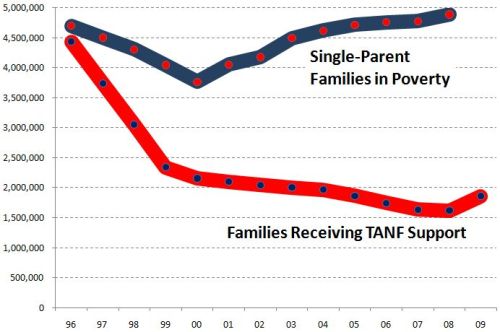
One important issue remains, however, and that is some measure of the need for welfare. So consider the number of single-parent families below the poverty line, compared with the number of families receiving TANF (formerly AFDC):

Now the story is much more clear.

After welfare reform in 1996, the number of families receiving welfare was cut by half in just a few years. At the same time, however, the number in poverty dropped. Since then, as the number in poverty has increased, the number on welfare has not. The two trends appeared to be uncoupled through most of the 2000s. In the last year we’ve seen the first increase in TANF numbers since 1996, but nowhere near enough to meet the increase in poor single-parent families.*

It is still the case that, although the stimulus bill allocated more money to TANF, the punitive rules and term limits have not been changed. So the system does not address longer-term poverty — something we should expect to see much more of in the next few years.

*We don’t have the official 2009 poverty rates yet, since they are compiled from a survey done in March 2010, to be released this fall.

Philip Cohen, PhD, is a professor of sociology at the University of North Carolina at Chapel Hill, where he teaches classes in demography, social stratification, and the family.  You can visit him at his blog, Family Inequality, and see his previous posts on SocImages here, here, and here.

Lisa Wade, PhD is an Associate Professor at Tulane University. She is the author of American Hookup, a book about college sexual culture; a textbook about gender; and a forthcoming introductory text: Terrible Magnificent Sociology. You can follow her on Twitter and Instagram.

Sanguinity sent in an interesting, if disheartening, report by Insight Center for Community Economic Development. The report looks at the assets owned by women of color and the wealth gap between them and men of different racial/ethnic groups.

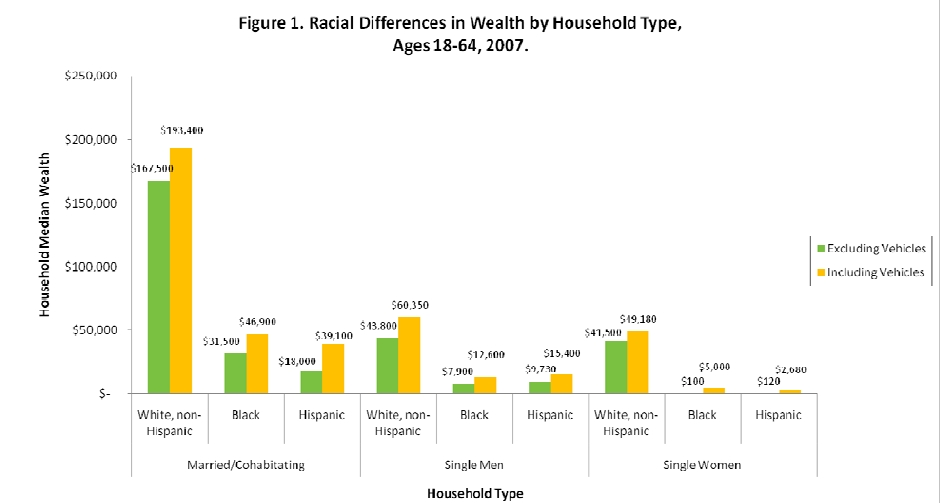
An overview of wealth (the value of all assets minus the value of debts) broken down by race/ethnicity and type of household:

Of course, the most striking finding there are the major disparities by race, particularly how much wealth White non-Hispanics have compared to all other groups (largely due to owning more valuable homes). Notice that single White men and women have higher median household wealth than married Black or Hispanic couples. This is astounding.

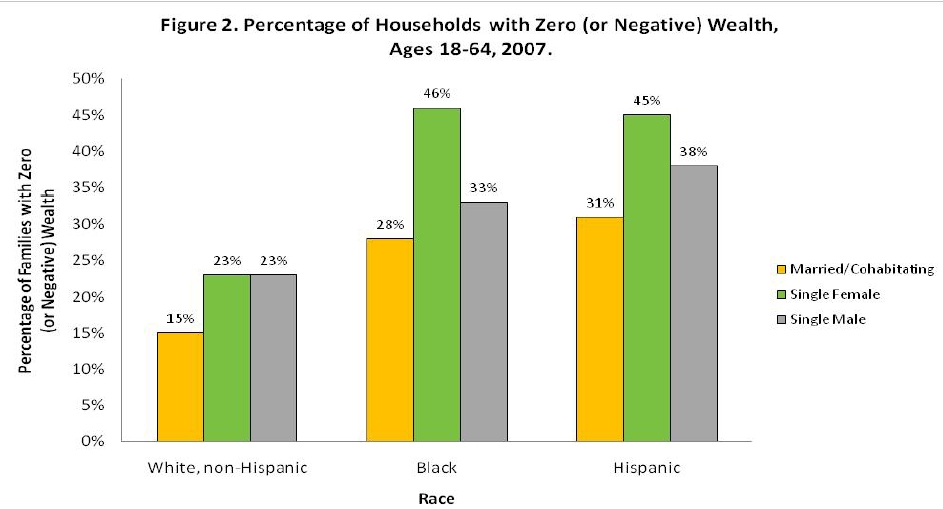
Blacks and Hispanics are more likely than Whites to have no wealth at all, or to have debts outweigh all assets; again, unmarried Whites are better off in this regard than are married Blacks and Hispanics:

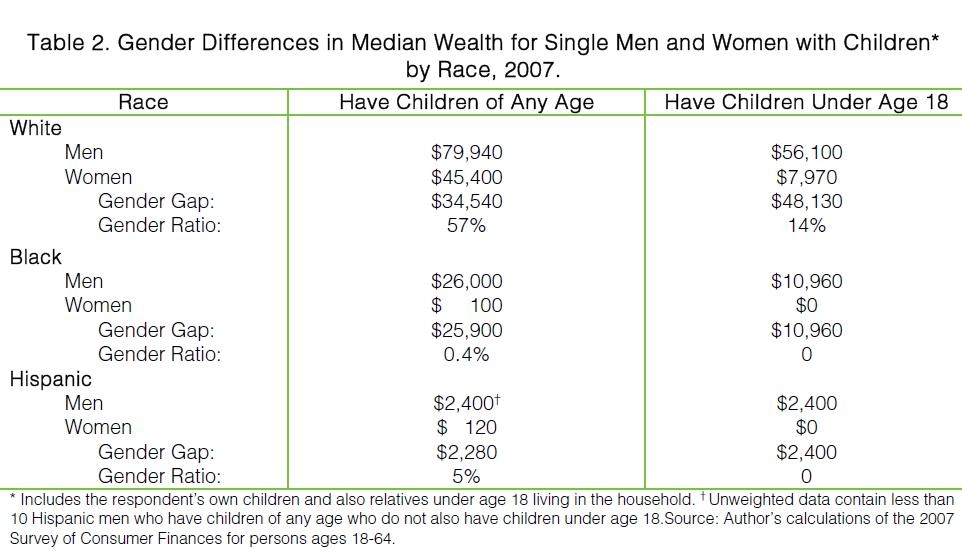
Among single parents, women appear to bear a disproportionate amount of the financial hardships of caring for children. White single mothers with children of any age (second column) have only 57% as much wealth as White single fathers; the equivalent ratio for Blacks is 0.4% and for Hispanics, 5%. Read that again: 0.4% and 5% as much wealth as single fathers from the same race! And take a look at the actual cash value: median wealth for Black women is $100, and for Hispanic women, it’s $120!

But then look at that third column! If you’re a single mother and have children under the age of 18 — who are more likely to be living with you than with their father — your financial picture is pretty dismal. Black and Hispanic women with children under age 18 have a median wealth of zero, meaning half have no wealth at all or owe more than all their assets combined are worth. Even White women, who are absolutely wealthy by comparison, have only 14% as much wealth as White single fathers with children under age 18.

Thinking about the implications of those numbers — the very meager financial resources available to many families, the particularly difficult situation of single mothers of all races, what this means for a family’s ability to cope with a crisis such as a car breaking down or a medical emergency, the ability to come up with deposits for an apartment — is mind-blowing.

The report has quite a bit of other information too, so if you’re interested in this topic, go check it out.