class

Rick T. sent in a link to a post at Global Research about some new U.S. Census data about 2009 poverty rates. As is usually true, children suffer higher levels of poverty than other age groups:

Poverty is significantly higher for African Americans than for the U.S. population overall — notice the Y axis goes up to 45%, whereas above it ends at 30%:

From the post:

Being American gives you a one in seven chance of being poor. Being young raises this chance to one in four. Further, being black in America means a one in four chance of being poor. Being young and black raises your chance of being poor up to one in 2.5.

Not surprisingly, poverty is highly related to education level:

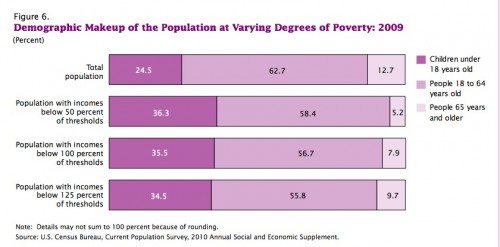
I went to the original Census report and grabbed some more images. This graph makes the over-representation of children among the poor even more obvious:

There’s tons of information in the report if you’re interested in the demographics of poverty in the current economic recession.

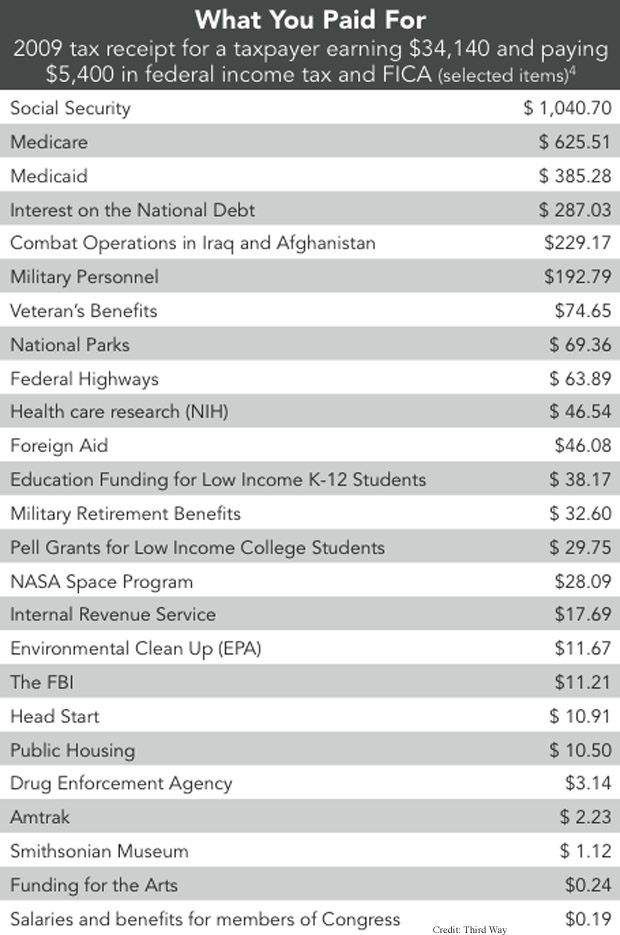
Third Way, which describes itself as “the leading moderate think-tank of the progressive movement,” proposes that taxpayers should get a receipt showing where their taxes go. They point out,

For many Americans, the amount they pay in taxes is larger than any purchase they make during the year, but studies show they know almost nothing about where that money goes to. This contributes to ridiculous beliefs, like the view that 20% of government spending goes to foreign aid, for example.

They provide a sample receipt for a taxpayer making $34,140, the median income in 2008; the receipt doesn’t include everything, but major categories of interest or that taxpayers tend to be very unclear how much money is spent on:

Via Talking Points Memo.

It’s not a receipt, but you can calculate how much you pay in taxes to various programs based on your income here.

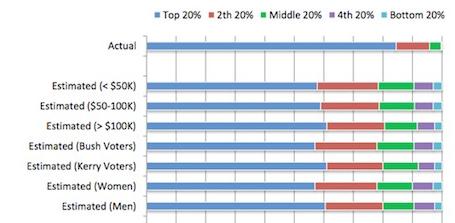
Dmitriy T.M. let us know that Matthew Yglesias posted an interesting graph that compares the actual distribution of wealth in the U.S. compared to what different groups estimate the distribution to be:

As Yglesias says, it’s striking not just that we underestimate how much wealth the top 20% control, but how little the poorest Americans do. Americans imagine the poor to have many, many more financial resources than they actually do.

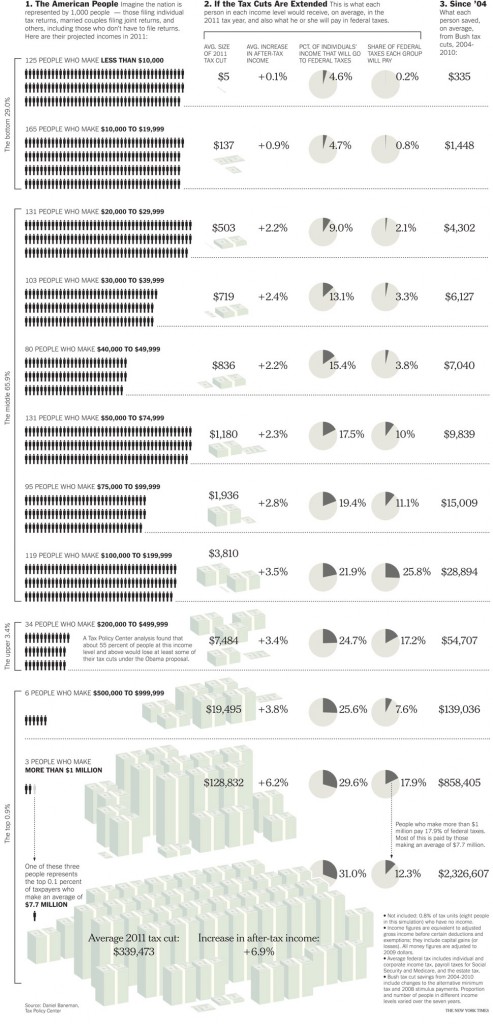
American politicians are currently wrangling over whether to extend the Bush tax cuts of 2001 and 2003. Word on the street is that extending these cuts will cost the U.S. treasury $2.7 trillion over the next ten years.  A graphic from the New York Times shows how much people with different incomes benefited from these tax cuts. If you look at the far right column you’ll see the average number of dollars left in people’s pockets between 2004 and 2010; the dollar amount rises from the poorest 29% of Americans (top with $355) to the richest 1% (bottom with $2,326,607).

Click over for a larger image; via BoingBoing.

—————————

Lisa Wade is a professor of sociology at Occidental College. You can follow her on Twitter and Facebook.

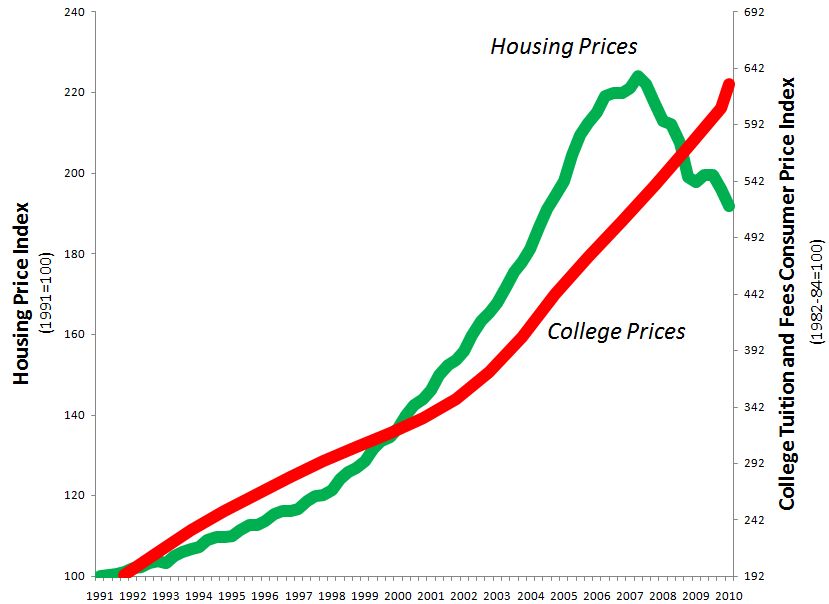
At Family Inequality, Philip Cohen argues that the rising cost of higher education may be directly related to the cost of homes. In the figure below, he shows that housing prices and college tuition have risen in tandem, at least until recently:

Cohen doesn’t chalk this up to simple inflation influencing both trends. Instead, he argues…

…the connection between home wealth and college attendance was sometimes direct, as when experts advised parents to use home equity loans to send their kids to college (advice you don’t hear so much these days). But even without home equity loans, the wealth stored in middle-class homes — for most such families their largest asset — underwrote millions of college educations.  I guess you could say the federal policies promoting homeownership were big boons for the higher education industry, not just the GIs and mostly-white suburbanites who landed inside the picket fences.

That is, rising home prices meant that people who could afford those homes could pay more for their children’s college educations.  The price of college, then, could afford to increase without pricing out all those middle- and upper-class families.

Cohen asks for ideas about what will happen now that home prices have dipped and the cost of higher education continues to rise.

Lisa Wade, PhD is an Associate Professor at Tulane University. She is the author of American Hookup, a book about college sexual culture; a textbook about gender; and a forthcoming introductory text: Terrible Magnificent Sociology. You can follow her on Twitter and Instagram.

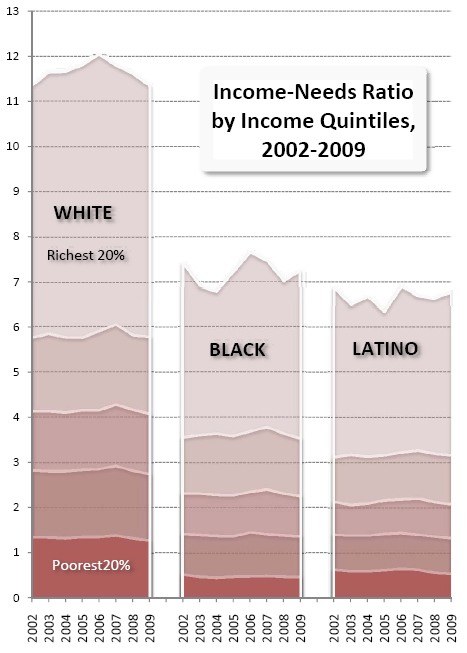
Yesterday I posted the news that the percent of Americans in poverty reached nearly 15% in 2009.  Philip Cohen, at Family Inequality, used the same Census data to give us an idea of how both wealth and poverty are distributed across U.S. racial groups.  We know that Blacks, Latinos, American Indians and some, but not all, Asian sub-groups are poorer, on average, than Whites.  Cohen offers us a different way of looking at this, however, by plotting the income-to-needs ratio for Whites, Blacks, and Latinos over the last 8 years.

That income-need ratio is, by definition, 1.0 at the poverty line, and numbers above that are multiples of needs, so 3.0 is income of 3-times the poverty line.

That ratio sits along the vertical axis, with time at the horizontal:

This, Cohen explains, “…allows us to see the size of the White advantage…”  He continues:

So, for example, the richest 5th of Whites are above 11-times the poverty line, while the poorest 5th of Whites are (on average) just above the poverty line. In contrast, the richest 5th of Blacks and Latinos are around 7-times the poverty line, and 40% of both groups are below 1.5-times the poverty line.

It’s not simply, then, that Blacks and Latinos are disproportionately poor.  Their poor are also poorer than the poor Whites and their rich are less rich than rich Whites.

Lisa Wade, PhD is an Associate Professor at Tulane University. She is the author of American Hookup, a book about college sexual culture; a textbook about gender; and a forthcoming introductory text: Terrible Magnificent Sociology. You can follow her on Twitter and Instagram.

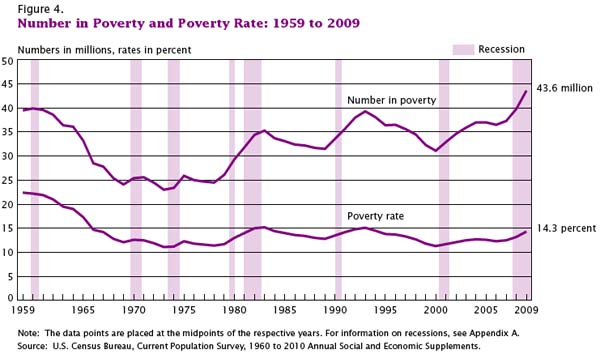
This week the U.S. Census Bureau reported that the American poverty rate has reached 14.3%, the highest it has been in 15 years:

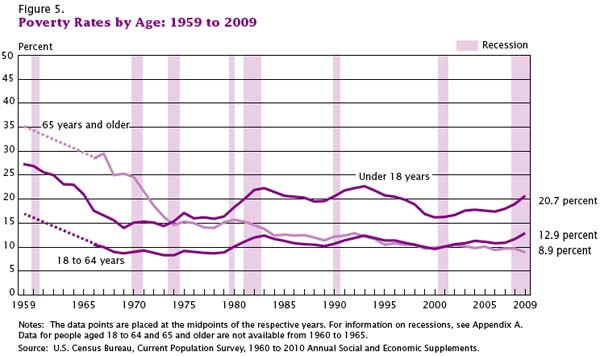
Children are over-represented among the poor; among those  less than 18-years-old, the poverty rate is 20.7%:

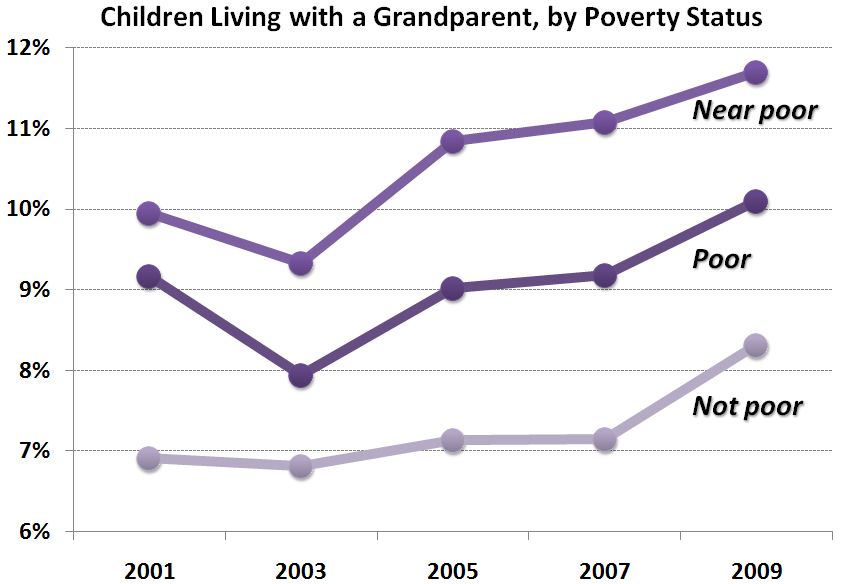
The Census report suggests that the poverty rate would be even higher if it weren’t for an increase in non-nuclear family households.  Over the last two years, an additional 11.6 percent of households now include non-family or family members from three generations or more.  Consider this data from Philip Cohen’s Family Inequality blog (and notice that the near poor are more likely to be living with a grandparent than the poor, who may not have this option):

So, the economic recession is correlated with an increase in poverty, but what does “poverty” really mean?   The New York Times reports that in 2009 it meant a pretax income of $10,830 for a single person with no dependents and less than twice that, $22,050, for a family of four.

Trying to imagine keeping a roof over my head, sufficient food in my belly, and clothes on my back on that amount of money is difficult.  But even if this was possible, human beings  need more than food, shelter, and clothes.  Try to imagine, with this amount of money, maintaining friendships and romantic partnerships, nurturing your children’s emotional health and educational potential, having pride and comfort in your home and personal appearance, finding the resources to invest in your own human capital, or giving yourself a modicum of leisure.  Poor people are human too and these numbers only begin to scratch the surface of the kind of deprivation many Americans suffer every day.

Images borrowed from Graphic Sociology.

Lisa Wade, PhD is an Associate Professor at Tulane University. She is the author of American Hookup, a book about college sexual culture; a textbook about gender; and a forthcoming introductory text: Terrible Magnificent Sociology. You can follow her on Twitter and Instagram.

Cross-posted at Jezebel.

Sociologist Michael Kimmel passed along a fantastic and entertaining example of resistance.  In the video below, a Columbia University a cappella group sings Dr. Dre’s Bitches Ain’t Shit.  The appropriation of the song works on so many levels: the all heavily-white, all-female group, the sweet choral arrangement, the pastel prep fashion, the strategically placed tennis rackets. They use race, class, and gender contradictions to force us to see and hear the song in a new way. All serve to mock the original, taking the teeth out of the language at the same time that they expose it as grossly misogynistic. Awesome.

Lisa Wade, PhD is an Associate Professor at Tulane University. She is the author of American Hookup, a book about college sexual culture; a textbook about gender; and a forthcoming introductory text: Terrible Magnificent Sociology. You can follow her on Twitter and Instagram.