
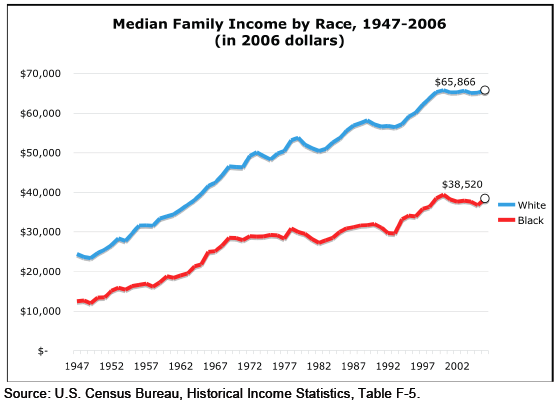
Here are some graphs on the income and wealth gap between Whites and Blacks in the U.S.

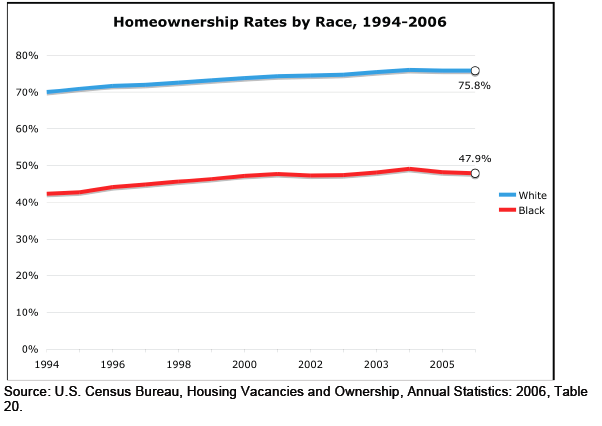
This next one shows homeownership rates. I know some people are going to point out that Blacks are more concentrated in urban areas than Whites are, and so it might make more sense to break down homeownership by area (rural, urban, suburban). While that might be a legitimately useful comparison, it also brings up the question of why African Americans would be more concentrated in urban areas, which could lead to a discussion of government programs that encourage Whites to buy homes in the suburbs after WWII while denying those opportunities to Blacks.
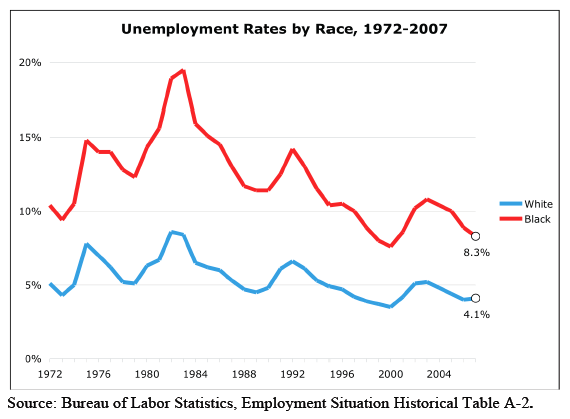
One way of explaining higher unemployment rates among Blacks is that there is some individual or cultural deficiency–African Americans are lazy, or want a hand-out, or don’t look for work, etc. etc. I like to show trend comparisons like these because they undermine those types of explanations. If African American unemployment was due to laziness, a “culture of poverty,” or other deficiencies, it would be unlikely for Black and White unemployment rates to show the same pattern (or, for that matter, any pattern–unless you believe African Americans just got a lot lazier in, say, 1982). What we see here is that Black and White unemployment rates follow a very similar pattern, but that during hard economic times, sugh as the early 1980s and around 1992, African Americans suffer disproportionately.
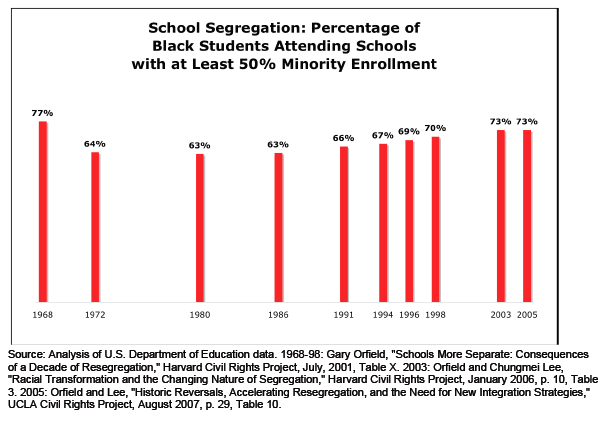
This one shows the slow but steady trend toward resegregation of our schools:
All of these were found at the Working Group on Extreme Inequality website.
Comments 8
T B — October 25, 2008
Of course, "black" and "white" are social categories without a basis in nature. Graphs like that seem to suggest otherwise, however -- as though there are essentially clear-cut divisions between 'blacks' and 'whites.'
Of course, there are other definitions (e.g. of "employment") underlieing the graphs, but they don't involve claims to the effect of being a matter of natural binaries -- rather than socially constructed and contested ones that can change, that can be interpreted differently, etc.
T B — October 25, 2008
To get into jargon, basically I'm saying that those graphs reify race (as a set of pigeon-holes that supposedly are natural)
Gwen Sharp, PhD — October 25, 2008
Yeah, that's always true when you discuss race. I always explain to my students that I present information about racial differences in class b/c, though the categories aren't biologically meaningful, in a society stratified by race, they are SOCIALLY meaningful, and thus worth looking at in a sociology course.
ashley — March 5, 2009
stop being inequal
ashley — March 5, 2009
stop being unequal okay
ashley and yaritza — March 7, 2009
stop being so racist and start treating evrybody the same doesnt matter your race we are all equal plus isnt that what the constitution say all men are equal so start giving everybody the same and we dont give a damn if you think you is better cause your not
The Paradox of Black History Month » Sociological Images — February 10, 2010
[...] is a (flesh-colored) band aid, at best. If we don’t do the other stuff (e.g., challenging the web of racist institutions that preserve class and race privilege), then no amount of fried chicken [...]
The Growing Wealth Gap Between Blacks and Whites » Sociological Images — June 8, 2010
[...] addition to differences in income, there is a persistent wealth gap between black and white families in the U.S. The term [...]