Dmitriy T.M. sent in a video where Hans Rosling illustrates changes in wealth and life expectancy in 200 countries over the past 200 years, all in four minutes. Pretty neat!
Last month, Lisa posted a video of Devah Pager discussing her research on the effects of race and a criminal background, and the likelihood of being offered a job. Her experiment indicated that White men with a non-violent drug offense on their record were more likely to get a call back for a job interview than African American men with no criminal background at all.
A post at Discover magazine indicates a similar situation for Muslims in France. Researcher Claire Adida looked at the effects of having a name identified as Muslim on job prospects:
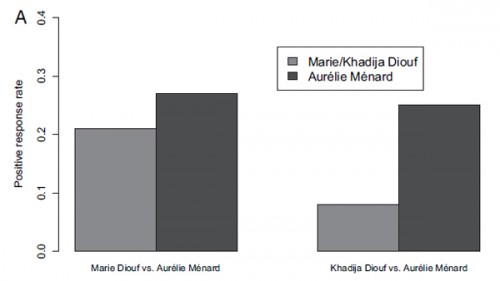
Adida did it by focusing on France’s Senegalese community, which includes a mix of both Muslims and Christians…Adida created three imaginary CVs. All were single, 24-year-old women, with two years of higher education and three years of experience in secretarial or accounting jobs. Only their names, and small details about past employers, differed.
The three chosen names were Khadija Diouf (an easily-recognizable Muslim first name, while Diouf is well-known as a common last name in France’s Senegalese community), Marie Diouf (to represent a Christian Senegalese name), and Aurélie Ménard (a common French name with no particular religious associations). To highlight the religious differences, “Khadija” had worked at Secours Islamique, a non-profit, “Marie” had worked for Secours Catholique, another religious non-profit, and “Aurélie” hadn’t worked for any religious-affiliated employers.
The fictional CVs were then sent out to employers who listed secretarial and accounting jobs with a national employment agency in the spring of 2009; the jobs were matched in pairs based on industry characteristics, size of the employing company, and the specific position. Every position was sent a copy of the CV for Aurélie; for each matched pair of jobs, one got Khadija’s CV while one got Marie’s.
The results are striking. Aurélie got the most responses of all three. However, Marie Diouf also got responses from 21% of the employers the CV was sent to. The nearly identical CV, however, when used with the name Khadija Diouf, got responses from only 8% of potential jobs:
The Discover post adds, “Even after Adida included a photo on the applications (the same one, showing a woman who was clearly not North African), she found the same bias.”
Aurélie’s chances of getting a call back were basically identical for each employer in the matched pairs, which would seem to indicate there weren’t glaring differences between the positions themselves that would account for the variation in responses. Adida’s research also helps control for the possibility that employers might be discriminating based on race/ethnicity, immigrant status, concerns about language, or other factors, by focusing on religious-associated names within a particularly recognizable ethnic group.
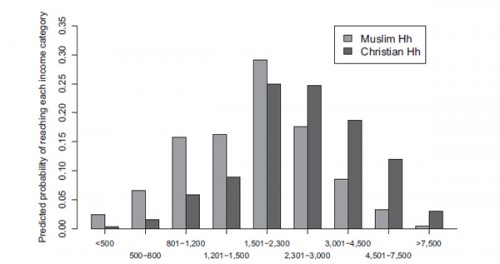
A recent survey of Senegalese households in France further indicates that religion affects life chances independent of ethnic background. The survey looked at the income of two Senegalese groups, one Muslim, one Christian:
Both groups arrived in France in the 1970s, so neither enjoyed an economic headstart, although the Christians were slightly better educated. The survey’s data revealed that the Muslim households were significantly poorer than their Christian counterparts, even after adjusting for their initial educational advantage. They’re more likely to fall into poorer income groups and they make around 400 Euros less per month, around 15% of the average monthly salary in France.
Here’s the income distribution, clearly showing Muslim households concentrated at lower incomes than Christian households:
Interestingly, the Discover post suggests this might, if anything, underestimate anti-Muslim bias in the job market, because the Senegalese community is relatively assimilated (particularly in terms of language) and not highly identified with Islam. Muslims from ethnic groups more strongly linked to Islam by the general public may face even higher levels of discrimination.
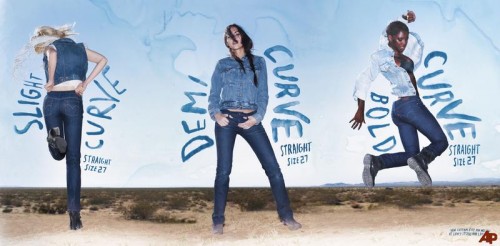
Gwen Sharp is an associate professor of sociology at Nevada State College. You can follow her on Twitter at @gwensharpnv.Hope and Kristi P. sent in another example of the way the idea of a “curvy” shape is associated with non-White bodies. This Levi’s ad for their Curve ID jeans shows models whose skin color gets progressively darker as they move from less to more curvy styles:
Notice also that curvy here means primarily having a larger butt. All three models are show in size 27 jeans, which generally are equivalent to about a size 4 (though of course, sizes vary greatly) — certainly larger than the average runway model, but still very small.
Question: does anyone have examples of non-White men depicted as uniquely or systematically “curvy,” or is this applied only to women?
An anonymous frequent reader sent in this Calvin Klein jeans ad that has been removed from billboards in Australia after the Advertising Standards Bureau banned its display on the grounds that it implies sexual assault. I’m putting it after the jump because it might be triggering for some people.
According to the Daily Mail, the Bureau said the image is offensive to both men and women. A Bureau member explained:
“The Board considered that whilst the act depicted could be consensual, the overall impact and most likely impression is that the scene is suggestive of violence and rape,” he said. “The Board considered that the image was demeaning to women by suggesting that she is a plaything of these men. It also demeans men by implying sexualised violence against women.”
Reminds me a lot of the infamous Dolce & Gabbana ad.

David Sparks created this video that uses blue and red to show shifts in voting patterns (Democratic vs. Republican) in all the presidential elections since 1920:
Sparks points out several interesting patterns that emerge:
1. Voting in urban areas often differs from other parts of their states (for example, Salt Lake City stands out from the rest of Utah, as did San Francisco from the rest of California in 1980).
2. We can see the South swing from solidly Democratic to predictably Republican (as Sparks highlights, the 1924 and 2004 maps are nearly inverted).
3. Despite clear patterns (such as the South going Republican, a coasts vs. interior voting split), we often see fairly drastic shifts between one presidential election and the next, as well as temporary disruptions to the overall trend (for instance, the reliably Republican South went Democratic in 1980).
As Sparks puts,
More broadly, this video is a reminder that what constitutes “politics as usual” is always in flux, shifting sometimes abruptly. The landscape of American politics is constantly evolving, as members of the two great parties battle for electoral supremacy.
He also has a thorough explanation of his methodology for creating the map, if you’re interested.
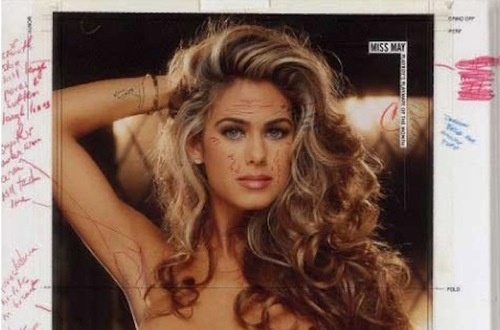
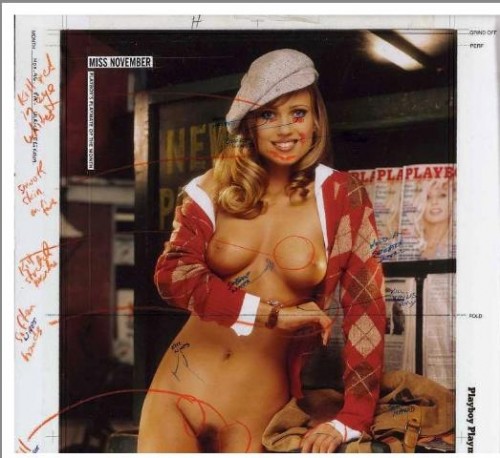
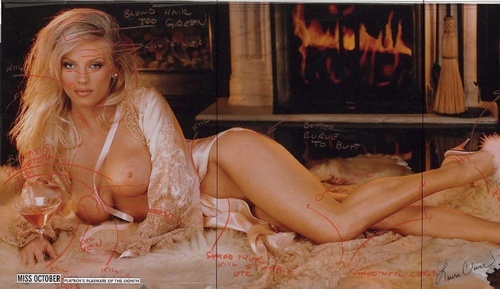
Dmitriy T.M. sent in a post by Irin Carmon at Jezebel about Playboy memorabilia up for auction, including images of centerfolds with editorial comments for the Photoshopper to fix various problematic aspects of the photos. The marked-up images gives us a peek into the process of creating a centerfold, as well as the scrutiny applied to literally every aspect of the models’ bodies, which are found wanting in a dizzying array of ways, with their blatant imperfections resulting from being actual living humans.
This one includes instructions to fix her large pores and soften her laugh lines (see the top left):
The rest of these images are *definitely* Not Safe for Work, so beware:
This model had unacceptable stretch marks, pubic hair stubble and blemishes around her genital area, and needed her forehead and hands softened:
Miss October 1998 had to have veins removed, a “better curve to butt” added, and lots of smoothing and eradication of nearly invisible moles and freckles. Also, her boobs are described as “too rough,” whatever, exactly, that means:
As Carmon says,
…the message is clear: even after a genetic bounty, all-but-certain plastic surgery and dieting, good lighting, a pro-photographer, and dozens of shots, even the fantasy woman is not fantastic enough.

A couple of weeks ago I posted a vintage ad referring to Bolsheviks and an interesting discussion ensued about the difficulty of knowing how seriously people would have taken ads at the time they were made and whether the ad would have been seen as a parody at the time. We have a tendency to see ourselves as particularly witty, sophisticated consumers of media and to think people in the past were more straight-forward, credulous, and took things at face value (I’ve certainly been guilty of it), as though sarcasm and parody are recent inventions.
I thought of that when I saw the video Michael M. sent in. It was made as an in-house joke by a producer of commercials in the 1960s and makes fun of cliches used in commercials at the time. It’s slightly NSFW–there are exposed breasts at about 4:10 in, as a reader pointed out.
It also, of course, pulls the curtain back on the advertising industry a bit. As Michael says,
Gwen Sharp is an associate professor of sociology at Nevada State College. You can follow her on Twitter at @gwensharpnv.We’ve all seen parodies of the old 50s and 60s style commercials, but I thought it very interesting (and telling) to see it parodied at the time of production, in knowing fashion by the very people who make them. These advertisers were well aware they were selling a fantasy.
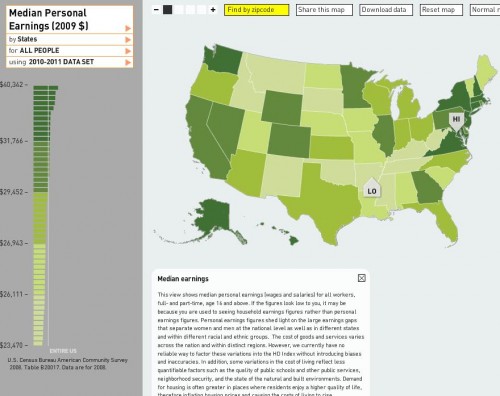
Dmitriy T.M. and Jeff H. sent in a link to Mapping the Measure of America, a website by the Social Science Research Council that provides an amazing amount of information about various measures of economic/human development in the U.S. Here’s a map showing median personal (not household) earnings in 2009:
The District of Columbia has the highest, at $40,342; the lowest is Arkansas, at $23,470 (if you go to their website, you can scroll over the bars on the left and it will list each state and its median income, or you can hover over a state).
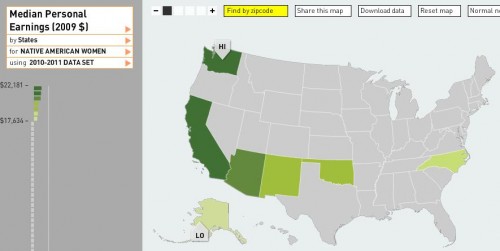
You can break the data down by race and sex as well. Here’s median personal income for Native American women, specifically (apparently there is only sufficient data to report for a few states):
Native American women’s highest median income, in Washington ($22,181), is lower than the overall median income in Arkansas, which is the lowest in the U.S. as we saw above.
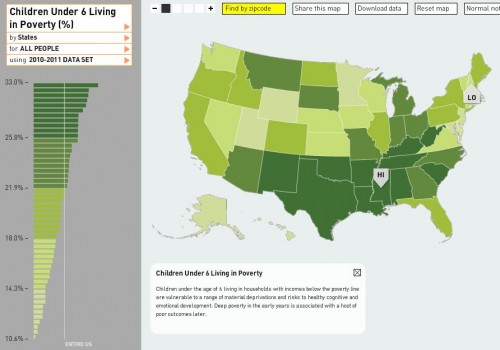
Here is the percent of children under age 6 who live below the poverty line (for all races):
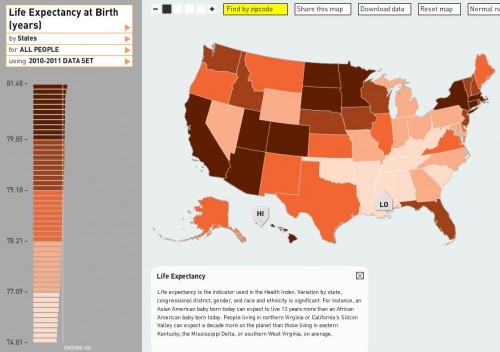
Life expectancy at birth differs by nearly 7 years between the lowest — 74.81 years in Mississippi — to the highest — 81.48 years in Hawaii:
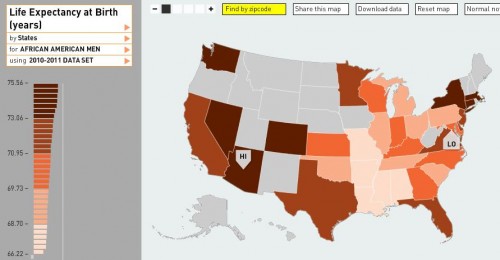
It’s significantly lower for African American men, however, with a life expectancy of only 66.22 years in D.C. (again, several states had insufficient data):
The site has more information than I could ever fully discuss here (including crime rates, various health indicators, all types of educational attainment measures, commuting time, political participation, sex of elected officials, environmental pollutants, and on and on), and it’s fairly addictive searching different topics, looking data up by zip code to get an overview of a particular area, and so on. Have fun!

