trans:prejudice/discrimination

In recent years, sociologists have given attention to hookup culture and other modern forms of dating. Too often, however, this discussion ignores the experiences of trans people, and occasionally it focuses too narrowly on the college campus, ignoring the current prevalence of dating apps among many age groups.

Rates of dating violence victimization from the video abstract of Garthe et al. (2021)

Focusing on trans experiences is especially important, as a 2021 study found that trans youth are twice as likely as cisgender women to have experienced physical dating violence, and fifty percent more likely to have experienced psychological dating violence. A 2023 study identified common experiences, most notably being fetishized and having to deal with others’ assumptions about trans people. “Because I’m a trans woman, people instantly assume that I must be this massive bottom,” said one participant. Another participant, a trans man, reported similar experiences, saying “I just felt like they weren’t talking to me. They were talking to an idea they had about me.”

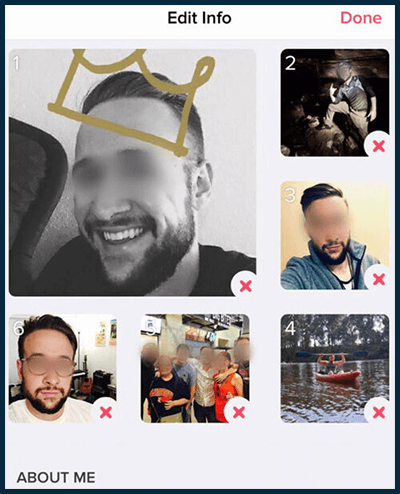
Other research has looked at trans people’s decisions to disclose their trans identity to prospective partners on dating apps. Most participants proactively and explicitly disclosed their identity, citing concerns about violence. One participant, who was genderfluid and lived in a rural area, mentioned that when meeting someone face-to-face from a dating app, they always thought, “that person could be the person that kills me.” Others, however, will engage in softer disclosure methods, such as showcasing different facets of their identity on apps that allow multiple profile pictures.

An example of using multiple profile photos on Tinder

Who is most vulnerable within the trans community? Another 2021 study found that BIPOC, queer, and transfeminine people are the most likely to have experienced dating violence. A 2022 study looked at the dating experiences of BIPOC trans women, finding their cis male partners would often conceal their relationship from the public. Consequences of this stigma included physical violence and psychological trauma. “We getting killed just because of the guys here were scared that they secret would come out,” said one woman. They also mentioned engaging in “survival strategies,” including hypervigilance, dressing to avoid being “found out,” and avoiding certain men.

The authors of these studies suggest several remedies to the problems they discussed. First is comprehensive trans-inclusive education, whether in the form of school curricula, sex education, or violence prevention training, which have been shown to make trans people and their partners more comfortable. Second, dating app users wanted better filtering options, with one person saying, “The majority of the interactions I have with cis men on dating apps are just shit, full stop . . . can I have less of them pop up?” Finally, some study authors recommended the prohibition of “trans panic defenses,” which allow perpetrators of violent crimes to justify their actions as a loss of control after learning their victim is transgender.

As trans people are reaching new levels of visibility and coming under fire in unprecedented ways, social science research shows us that it is important to look for ways to make for a safer and less anxious future for trans people as we look for romantic and sexual partners.

Leah Long is a history and sociology student at Macalester College who researches and writes about trans history and politics.

Democrats and Republicans are deeply divided. By definition, political parties have differences of opinion. But these divisions have widened. Twenty years ago, your opinions on political issues did not line up the way we have come to expect them. Today, when you find you share an opinion with someone about systemic racism, you’re more likely to have like minds about environmental policies, welfare reform, and how they feel about the poor, gay and lesbian people, immigrants and immigration, and much more. In other words, Democrats and Republicans have become more ideologically consistent in recent history.

A recent Pew Report reported that in 1994, 64% of Republicans were more conservative than the median Democrat on a political values scale. By 2014, 92% of Republicans were more conservative than the median Democrat. Democrats have become more consistently liberal in their political values and Republicans have become more consistently conservative. And this has led to increasing political polarization (see HERE and HERE for smart posts on this process by Lisa Wade and Gwen Sharpe). You can see political polarization happening below.

You might think ideological commitments naturally come in groupings. But there are lots of illogical pairings without natural connections. Why, for instance, should how you feel about school vouchers be related to how you feel about global warming, whether police officers use excessive force against Black Americans, or whether displays of military strength are the best method of ensuring peace?  The four issues are completely separate. But, if your Facebook feed looks anything like mine, knowing someone’s opinion about any one of these issues gives you enough information to feel reasonably confident predicting their opinions about the other three. That’s what ideological consistency looks like.

Consider how this process affects understandings of important systems of social inequality that structure American society. Discrimination is an issue that sociologists have studied in great detail. We know that discrimination exists and plays a fundamental role in the reproduction of all manner of social inequalities. But, people have opinions about various forms of discrimination as well—even if they’re unsupported by research or data. And while you might guess that many Americans’ opinions about one form of discrimination will be predictive of their opinions about other forms, there’s not necessarily a logical reason for that to be true. But it is.

The following chart visualizes the proportions of Americans who say there is “a lot of discrimination” against Black people, gay and lesbian people, immigrants, transgender people, as well as the proportions of Americans who oppose laws requiring transgender people to use bathrooms that correspond to their sex at birth. And you can see how Americans identifying as Democrat and Republican compare.

The majority of Americans understand that social inequalities exist and that discrimination against socially marginalized groups is still a serious problem. By that, I mean that more than half of Americans believe these things to be true. And data support their beliefs. But look at the differences between Democrats’ and Republicans’ opinions about important forms of discrimination in U.S. society. The gap is huge. While just less than 1 in 3 Republicans feels that there is a lot of discrimination against Black people in the U.S., almost 8 in 10 Democrats support that statement. That’s what political polarization looks like. And Pew found that the trend is even more exaggerated among voters.

Republicans and Democrats are not just divided about whether and what to do about forms of social inequality. They’re divided about whether these inequalities exist. And that is an enormous problem.Tristan Bridges, PhD is a professor at the University of California, Santa Barbara. He is the co-editor of Exploring Masculinities: Identity, Inequality, Inequality, and Change with C.J. Pascoe and studies gender and sexual identity and inequality. You can follow him on Twitter here. Tristan also blogs regularly at Inequality by (Interior) Design.

I love gender and sexual demography.  It’s incredibly important work.  Understanding the size and movements of gender and sexual minority populations can help assess what kinds of resources different groups might require and where those resources would be best spent, among others things.  Gary J. Gates and Frank Newport initially published results from a then-new Gallup question on gender/sexual identity in 2012-2013 (here).  At the time, 3.4% of Americans identified as either lesbian, gay, bisexual, or transgender.  It’s a big deal – particularly as “identity” is likely a conservative measure when it comes to assessing the size of the population of LGBT persons.  After I read the report, I was critical of one element of the reporting: Gates and Newport reported proportions of LGBT persons by state.  As data visualizations go, I felt the decision concealed more than it revealed.

From 2015-2016, Gallup collected a second round of data. These new data allowed Gates to make some really amazing observations about shifts in the proportion of the U.S. population identifying themselves as LGBT.  It’s a population that is, quite literally on the move.  I posted on this latter report here.  The shifts are astonishing – particularly given the short period of time between waves of data collection.  But, again, data on where LGBT people are living was reported by state.  I suspect that much of this has to do with sample size or perhaps an inability to tie respondents to counties or anything beyond state and time zone.  But, I still think displaying the information in this way is misleading.  Here’s the map Gallup produced associated with the most recent report:

During the 2012-2013 data collection, Hawaii led U.S. states with the highest proportions of LGBT identifying persons (with 5.1% identifying as LGBT)–if we exclude Washington D.C. (with 10% identifying as LGBT).  By 2016, Vermont led U.S. states with 5.3%; Hawaii dropped to 3.8%.  Regardless of state rank, however, in both reports, the states are all neatly arranged with small incremental increases in the proportions of LGBT identifying persons, with one anomaly–Washington D.C.  Of course, D.C. is not an anomaly; it’s just not a state. And comparing Washington D.C. with other states is about as meaningful as examining crime rate by European nation and including Vatican City.  In both examples, one of these things is not like the others in a meaningful sense.

In my initial post, I suggested that the data would be much more meaningfully displayed in a different way.  The reason D.C. is an outlier is that a good deal of research suggests that gender and sexual minorities are more populous in cities; they’re more likely to live in urban areas.  Look at the 2015-2016 state-level data on proportion of LGBT people by the percentage of the state population living in urban areas (using 2010 Census data).  The color coding reflects Census regions (click to enlarge).

Vermont is still a state worth mentioning in the report as it bucks the trend in an impressive way (as do Maine and New Hampshire).  But I’d bet you a pint of Cherry Garcia and a Magic Hat #9 that this has more to do with Burlington than with thriving communities of LGBT folks in the towns like Middlesex, Maidstone, or Sutton.

I recognize that the survey might not have a sufficient sample to enable them to say anything more specific (the 2015-2016 sample is just shy of 500,000).  But, sometimes data visualizations obscure more than they reveal.  And this feels like a case of that to me.  In my initial post, I compared using state-level data here with maps of the U.S. after a presidential election.  While the maps clearly delineate which candidate walked away with the electoral votes, they tell us nothing of the how close it was in each state, nor do they provide information about whether all parts of the state voted for the same candidates or were regionally divided.  In most recent elections traditional electoral maps might leave you wondering how a Democrat ever gets elected with the sea of red blanketing much of the nation’s interior.  But, if you’ve ever seen a map showing you data by county, you realize there’s a lot of blue in that red as well–those are the cities, the urban areas of the nation.  Look at the results of the 2016 election by county (produced by physicist Mark Newman – here).  On the left, you see county level voting data, rather that simply seeing whether a state “went red” or “went blue.”  On the right, Newman uses a cartogram to alter the size of each county relative to its population density.  It paints a bit of a different picture, and to some, it probably makes that state-level data seem a whole lot less meaningful.

Maps from Mark Newman’s website: http://www-personal.umich.edu/~mejn/election/2016/

The more recent report also uses that state-level data to examine shifts in LGBT identification within Census regions as well.  Perhaps not surprisingly, there are more people identifying as LGBT everywhere in the U.S. today than there were 5 years ago (at least when we ask them on surveys).  But rates of identification are growing faster in some regions (like the Pacific, Middle Atlantic, and West Central) than others (like New England).  Gates suggests that while this might cause some to suggest that LGBT people are migrating to different regions, data don’t suggest that LGBT people are necessarily doing that at higher rates than other groups.

The recent shifts are largely produced by young people, Millennials in the Gallup sample.  And those shifts are more pronounced in those same states most likely to go blue in elections.  As Gates put it, “State-level rankings by the portion of adults identifying as LGBT clearly relate to the regional differences in LGBT social acceptance, which tend to be higher in the East and West and lower in the South and Midwest. Nevada is the only state in the top 10 that doesn’t have a coastal border. States ranked in the bottom 10 are dominated by those in the Midwest and South” (here).

When we compare waves of data collection, we can see lots of shifts in the LGBT-identifying population by state (see below; click to enlarge).  While the general trend was for states to have increasing proportions of people claiming LGBT identities in 2015-2016, a collection of states do not follow that trend.  And this struck me as an issue that ought to provoke some level of concern.  Look at Hawaii, Rhode Island, and South Dakota, for example.  These are among the biggest shifts among any of the states and they are all against the liberalizing trend Gates describes.

Presentation of data is important.  And while the report might help you realize, if you’re LGBT, that you might enjoy living in Vermont or Hawaii more than Idaho or Alabama if living around others who share your gender or sexual identity is important to you, that’s a fact that probably wouldn’t surprise many.  I’d rather see maps illustrating proportions of LGBT persons by population density rather than by state.  I don’t think we’d be shocked by those results either.  But it seems like it would be provide a much better picture of the shifts documented by the report than state-level data allow.Tristan Bridges, PhD is a professor at the University of California, Santa Barbara. He is the co-editor of Exploring Masculinities: Identity, Inequality, Inequality, and Change with C.J. Pascoe and studies gender and sexual identity and inequality. You can follow him on Twitter here. Tristan also blogs regularly at Inequality by (Interior) Design.

According to the Southern Poverty Law Center, the US saw a spike of hate incidents after the election of Donald Trump on November 8th. 867 real-world (i.e., not internet-based) incidents were reported to the Center or covered in the media in just 10 days. USA Today reports that the the Council on American-Islamic relations also saw an uptick in reports and that the sudden rise is greater than even what the country saw after the 9/11 attacks. This is, then, likely just a slice of what is happening.

The Center doesn’t present data for the days coming up to the election, but offers the following visual as an illustration of what happened the ten days after the 8th.

2

If the numbers of reports prior to the 8th were, in fact, significantly lower than these, than there was either a rise in incidents after Trump’s victory and Clinton’s loss, or an increase in the tendency to report incidents. Most perpetrators of these attacks targeted African Americans and perceived immigrants.

8

The most common place for these incidents to occur, after sidewalks and streets, was K-12 schools. Rosalind Wiseman, anti-bullying editor and author of Queen Bees and Wannabes, and sociologist CJ Pascoe, author of Dude, You’re a Fag, both argue that incidents at schools often reflect adult choices. Poor role models — adults themselves who bully or who fail to stand up for the bullied — make it hard for young people to have the moral insight and strength to do the right thing themselves.Lisa Wade, PhD is an Associate Professor at Tulane University. She is the author of American Hookup, a book about college sexual culture; a textbook about gender; and a forthcoming introductory text: Terrible Magnificent Sociology. You can follow her on Twitter and Instagram.

Many are aghast at a cartoon recently released by a well-known right-leaning cartoonist, Ben Garrison. Rightly, commentators are arguing that it reproduces the racist stereotype that African American women are more masculine than white women. I’ll briefly discuss this, but I want to add a twist, too.

The block versus cursive font, the muscularity and the leanness, the strong versus swishy stance, the color and cut of their dresses, the length of their hair, the confrontational versus the compliant facial expression, and the strategically placed, transphobic bulge in Michelle Obama’s dress — you could hardly do a better job of masculinizing Michelle and feminizing Melania.

This is a racist stereotype not only because it posits that black women are unattractive, unlikable, and even dangerous, but because it has its roots in American slavery. We put middle class white women on pedestals, imagining them to be fragile and precious. But if women were fragile and precious, how could we force some of them to do the hard labor we forced on enslaved women? The answer was to defeminize black women. Thanks for keeping the stereotype alive, Ben Garrison.

What I’d like to add as a twist, though, is about Michelle’s expression, purposefully drawn as both ugly and judgmental. Michelle’s face isn’t just drawn as masculine, it’s aimed at Melania and she isn’t just sneering, she’s sneering at this other women.

The cartoon also places women in competition. It tells a sexist story of ugly (black) women who are hateful toward beautiful (white) women. It tells a story in which women are bitter and envious of each other, a ubiquitous story in which women tear each other down and can’t get along. It’s a terrible stereotype, demeaning and untrue (except insofar as patriarchal relations make it so).

And it’s especially reprehensible when it’s layered onto race.Lisa Wade, PhD is an Associate Professor at Tulane University. She is the author of American Hookup, a book about college sexual culture; a textbook about gender; and a forthcoming introductory text: Terrible Magnificent Sociology. You can follow her on Twitter and Instagram.

It can be quite difficult to describe what it feels like to be a member of a group that is widely disparaged or hated. I mean really describe it in a way that other people who are not part of that group can understand. It is powerful when it can be done and even more powerful when it is done in a way such that members of other groups, who are disparaged or hated for other reasons, can see themselves in the story.

I think this is accomplished in the 10 minute monologue below. The speech is by Rory O’Neill, a famous Irish drag queen who goes by the name Panti Bliss. She speaks of what it feels like to encounter homophobia — indeed, to have internalized homophobia — and to try to manage life with an identity that some people openly disparage and hate.

She does such a wonderful job describing it, that I suspect that the feelings that she talks about might be familiar to a wide audience: women, people of color, people with disabilities, the homeless and the poor, people who speak English as a second language, and more.

Lisa Wade, PhD is an Associate Professor at Tulane University. She is the author of American Hookup, a book about college sexual culture; a textbook about gender; and a forthcoming introductory text: Terrible Magnificent Sociology. You can follow her on Twitter and Instagram.