race/ethnicity

Racialicious posted a link to what looks like a fantastic project.  Titled Question Bridge, it focuses our attention on what they call “arguably the most opaque and feared demographic in America”: Black men.  In the film, participants look directly at the camera, creating a feeling of intimacy, and ask and answer tough questions.

The trailer gives you a taste:

A primary lesson the producers aim to impart is the diversity within the category in order to challenge stereotypes.  They write:

By creating an identity container (e.g. “Black” and “Male”), then creating a way of releasing the diversity of identities and thought within that container, we can break the container.

The project is already getting recognition from film festivals.  Also, there’s a donate button.

Lisa Wade, PhD is an Associate Professor at Tulane University. She is the author of American Hookup, a book about college sexual culture; a textbook about gender; and a forthcoming introductory text: Terrible Magnificent Sociology. You can follow her on Twitter and Instagram.

Barack Obama won just over 50% of the popular vote last week, but he earned 80% of non-white votes.  According to USA Today exit poll data, he secured 93% of the Black vote, 73% of the Asian vote, 71% of the Hispanic vote, and 58% of the non-white Other vote.

This data suggests are real and palpable difference between how (some) Whites and (most) non-Whites see the world, a difference that will become increasingly influential.

Earlier this month the Pew Research Center released an updated prediction for the racial/ethnic composition of the U.S. in 2050.  They expect that, by 2050, Whites will be a minority, adding up to only 47% of the population.  By that time, they expect Hispanics to account for 29% of the population, and Blacks and Asians to account for 13% and 9% respectively.

Paul Taylor and D’Vera Cohn, at Pew, observe that the demographics of the voting population will change a bit slower since the majority of the demographic change is from births and deaths, not immigration.  In 2011, for example, whites were 66% of those ages 18 and older, but only 56% of 18-year-olds.  In other words, it takes 18 years to grow a voter.

Whatever the pace of change, the era of winning U.S. elections by pandering to the worldview of a single group is ending.  Future politicians will likely have to put effort into attracting a wide range of voters, as Obama did on Tuesday.

Lisa Wade, PhD is an Associate Professor at Tulane University. She is the author of American Hookup, a book about college sexual culture; a textbook about gender; and a forthcoming introductory text: Terrible Magnificent Sociology. You can follow her on Twitter and Instagram.

I know everyone is tired of hearing or thinking about the U.S. presidential election, but Latino Decisions has released an interactive website that shows how Latinos/as in the U.S. voted, as well as the issues they found particularly important.

In many of the swing states, Latinos formed an essential part of President Obama’s winning coalition of voters. As you may have heard by now, Latinos voted overwhelmingly Democratic, with about 3/4 voting for President Obama:

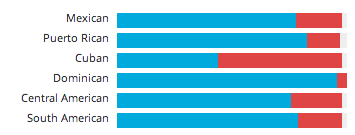
But this varied by ancestry. Among Cuban Americans, only 44% supported Obama, while he received 96% of votes cast by Dominican Americans, 78% by Mexican Americans, 83% by Puerto Ricans, 76% by Central Americans, and 79% by South Americans (hover over the graph here to see the %s):

Language also made a difference. Among those who speak primarily English, Obama got 70% of the vote; among those who speak Spanish, it was 83%:

Religion was an even bigger factor. While 81% of Catholic Latinos voted for President Obama, he got a much smaller majority — 54% — among those who identified as born-again Christians:

The website also lets you get specific data on a number of swing states or states with large or growing Latino populations, as well as breakdowns of the issues that Latino voters said were most important to them. It’s an interesting website with a lot of breakdowns, so it’s worth clicking over and looking around.

Gwen Sharp is an associate professor of sociology at Nevada State College. You can follow her on Twitter at @gwensharpnv.

…voting rights still excluded certain groups?

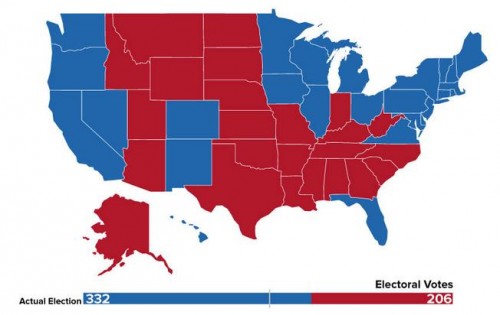
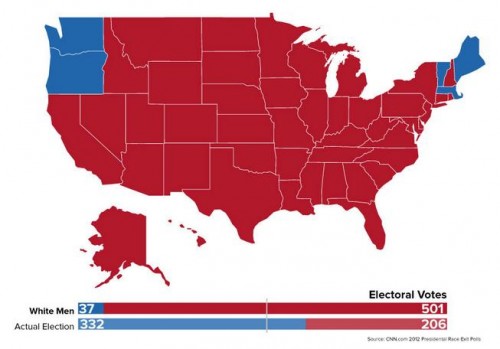
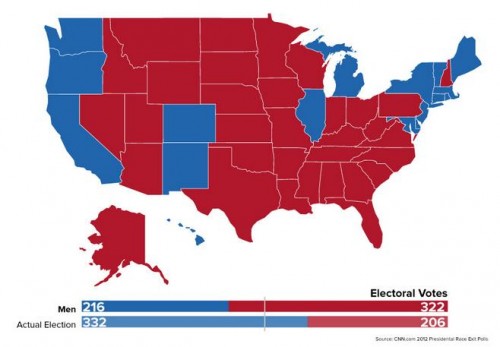
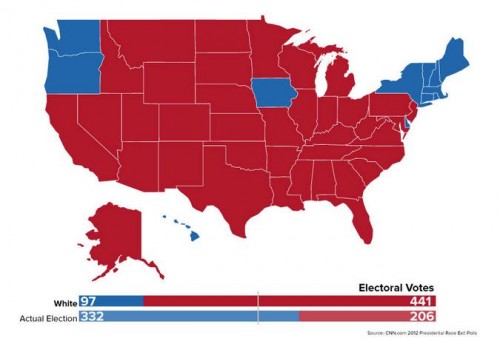
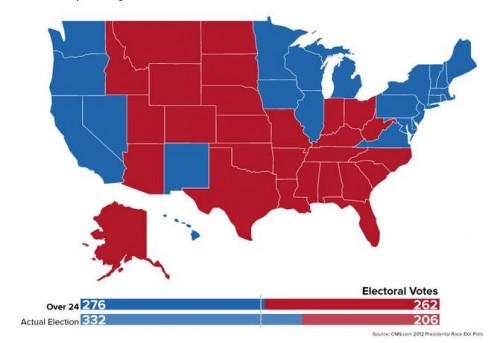
Buzzfeed has put together a great collection of U.S. maps showing what last Tuesday’s election would have looked like if women, non-whites, and 18- to 23-year-olds had never been given the vote.

Actual results:

Results with just white men:

Results with only men, all races:

Results with only white people, men and women:

Results excluding people 18- to 23-years-old:

The results are stunning and are a hint of just how consequential the ongoing voter suppression and disenfranchisement can be.

Lisa Wade, PhD is an Associate Professor at Tulane University. She is the author of American Hookup, a book about college sexual culture; a textbook about gender; and a forthcoming introductory text: Terrible Magnificent Sociology. You can follow her on Twitter and Instagram.

Over at his blog, Made in America, Claude Fischer discusses data showing that the percentage of (White) Americans who say that they will vote for a qualified Black president has been rising since the 1950s. Today it sits at about 96%.

Fischer rightly observes that it’s difficult to know exactly what to make of this information. The trend likely reflects a combination of a real decrease in prejudice and a rising appreciation for the fact that it’s unpopular to admit that you wouldn’t vote for a Black person, even on a survey.

Still, assuming for the moment that it represents real attitudinal change, Fischer asks, is “the glass 96 percent full or is it 4 percent empty?”  Given our two-party partisan political system, elections are frequently decided by margins this narrow.  Obama won with just 53% of the popular vote in 2008.  Political scientists estimate that there was a 5 point racial penalty (that is, if he had been White, he would likely have won 58% of the vote).

Tomorrow is election day and it’s difficult to know if race will play more or less of a role than it did in the last election.  On the one hand, most people who were worried that Obama would be a racially radical President now know that he is not (some people will never be convinced) and others may have become more used to seeing an African American face in the White House.  On the other hand, racial progress usually incites a backlash.  That face in such a venerated position of power may have aggravated people who are now actively racist instead of complacently so.

Finally, as Fischer observes, we have absolutely no data on the penalty Romney will pay for being Mormon.

Happy election day eve, America. May we all end tomorrow with a strong beverage of consolation or celebration.

Lisa Wade, PhD is an Associate Professor at Tulane University. She is the author of American Hookup, a book about college sexual culture; a textbook about gender; and a forthcoming introductory text: Terrible Magnificent Sociology. You can follow her on Twitter and Instagram.

For whatever reason, there has been a real slump in the number of people typing “obama gun” (will he take our guns away?), “obama muslim” (the idea used to run at about 20%), “obama socialist” (the republic “hangs in the balance“), and “obama citizen” (thank you, Snopes) into the Google search box since the 2008 election.

Here’s the Google trend (and the search link):

We don’t know how much these fears, versus other concerns, will affect votes against him this year, although there have been some good efforts to track the effects of anti-Black racism on his vote tally.

Naturally, not everyone who Googles these things believes the underlying stories or myths. But it seems likely they either believe them, are considering them, heard someone repeat them, or are arguing with someone who believes them, etc. So I’m guessing – just guessing – that these trends track those beliefs.

But maybe four years of Obama as an actual president has softened up the hard-line hatred in some quarters. What do you think?

Philip N. Cohen is a professor of sociology at the University of Maryland, College Park, and writes the blog Family Inequality. You can follow him on Twitter or Facebook.

At the Washington Post, John Cohen and Rosalind Helderman report:

The 2012 election is shaping up to be more polarized along racial lines than any presidential contest since 1988, with President Obama experiencing a steep drop
in support among white voters from four years ago.

They compare data from a recent poll with exit interviews from 2004 and 2008.  The results show that, while Obama is overwhelmingly the favorite among non-whites, he trails him among whites by 23 percentage points.

Cohen and Helderman say that Obama has lost support among whites even just recently.  Meanwhile, a whopping 91% of Romney supporters are believed to be white. We are, truly, a deeply divided nation.

Lisa Wade, PhD is an Associate Professor at Tulane University. She is the author of American Hookup, a book about college sexual culture; a textbook about gender; and a forthcoming introductory text: Terrible Magnificent Sociology. You can follow her on Twitter and Instagram.
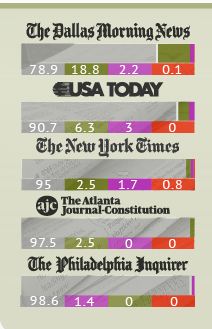
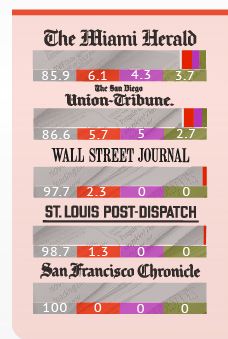
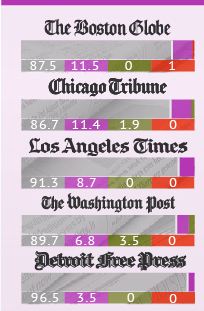
Larry Harnisch, of L.A.’s The Daily Mirror, let us know that 4th Estate analyzed the racial and ethnic breakdown of reporters covering the presidential election for 38 major print media outlets. The analysis included front-page articles published between January 1st and October 12th of this year.

Here’s the key for all of the following images:

For every major topic, the overwhelming majority of front-page articles were written by non-Hispanic Whites, while racial/ethnic minorities were underrepresented compared to the overall U.S. population:

Major newspapers varied in the diversity of those writing their feature articles. The Dallas Morning News was the most diverse, with a particularly large percentage (18.8) of front-page stories written by African American reporters. The San Francisco Chronicle had the least diversity; 100% of its feature political stories were written by White non-Hispanics:

Overall, 93% of the feature articles analyzed in the database were written by White non-Hispanics, 4% by Asian Americans, about 2% by African Americans, and less than 1% by Hispanics. Compare that with each group’s proportion of the overall U.S. population:

These numbers clearly matter in terms of career opportunities and exposure for minorities within the industry. But they also should concern us readers. What does the lack of diversity mean in terms of the issues covered, the political contacts and average-Joe-voters spoken to, the topics seen as important enough to cover?

Also see our earlier post on the gender of those quoted in news stories about the election.

Gwen Sharp is an associate professor of sociology at Nevada State College. You can follow her on Twitter at @gwensharpnv.