race/ethnicity

Lots of time and care consideration goes into the production of new superheroes and the revision of time-honored heroes. Subtle features of outfits aren’t changed by accident and don’t go unnoticed. Skin color also merits careful consideration to ensure that the racial depiction of characters is consistent with their back stories alongside other considerations. A colleague of mine recently shared an interesting analysis of racial depictions by a comic artist, Ronald Wimberly—“Lighten Up.”

“Lighten Up” is a cartoon essay that addresses some of the issues Wimberly struggled with in drawing for a major comic book publisher. NPR ran a story on the essay as well. In short, Wimberly was asked by his editor to “lighten” a characters’ skin tone — a character who is supposed to have a Mexican father and an African American mother.  The essay is about Wimberly’s struggle with the request and his attempt to make sense of how the potentially innocuous-seeming request might be connected with racial inequality.

In one panel of the cartoon, you can see Wimberly’s original color swatch for the character alongside the swatch he was instructed to use for the character.

Digitally, colors are handled by what computer programmers refer to as hexadecimal IDs. Every color has a hexademical “color code.” It’s an alphanumeric string of 6 letters and/or numbers preceded by the pound symbol (#).  For example, computers are able to understand the color white with the color code #FFFFFF and the color black with #000000. Hexadecimal IDs are based on binary digits—they’re basically a way of turning colors into code so that computers can understand them. Artists might tell you that there are an infinite number of possibilities for different colors. But on a computer, color combinations are not infinite: there are exactly 16,777,216 possible color combinations. Hexadecimal IDs are an interesting bit of data and I’m not familiar with many social scientists making use of them (but see).

There’s probably more than one way of using color codes as data. But one thought I had was that they could be an interesting way of identifying racialized depictions of comic book characters in a reproducible manner—borrowing from Wimberly’s idea in “Lighten Up.” Some questions might be:

  • Are white characters depicted with the same hexadecimal variation as non-white characters?
  • Or, are women depicted with more or less hexadecimal variation than men?
  • Perhaps white characters are more likely to be depicted in more dramatic and dynamic lighting, causing their skin to be depicted with more variation than non-white characters.

If any of this is true, it might also make an interesting data-based argument to suggest that white characters are featured in more dynamic ways in comic books than are non-white characters. The same could be true of men compared with women.

Just to give this a try, I downloaded a free eye-dropper plug-in that identifies hexadecimal IDs. I used the top 16 images in a Google Image search for Batman (white man), Amazing-man (black man), and Wonder Woman (white woman). Because many images alter skin tone with shadows and light, I tried to use the eye-dropper to select the pixel that appeared most representative of the skin tone of the face of each character depicted.

Here are the images for Batman with a clean swatch of the hexadecimal IDs for the skin tone associated with each image below:

2 (1)

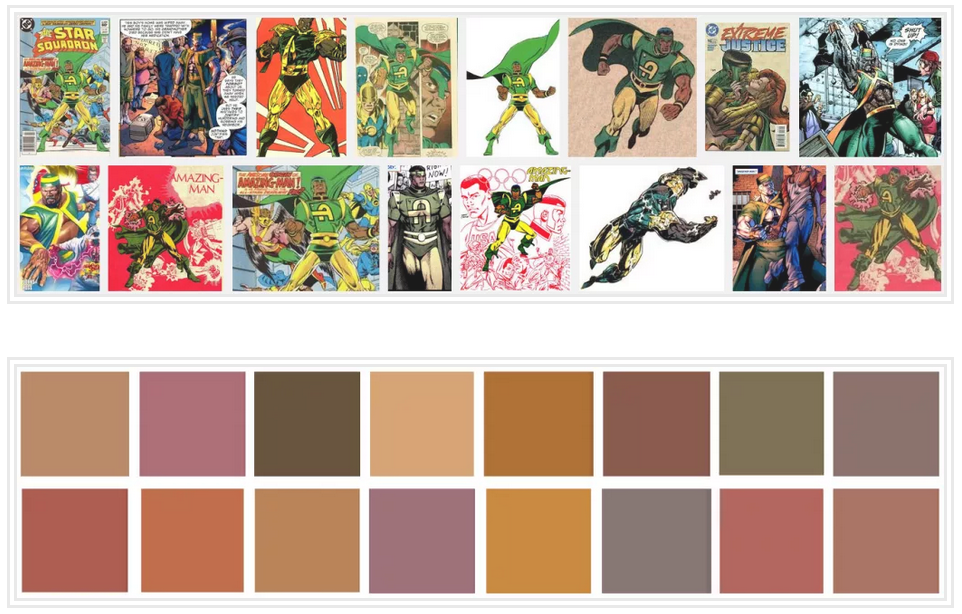
Below are the images for Amazing-man with swatches of the skin tone color codes beneath:

2

Finally, here are the images for Wonder Woman with pure samples of the color codes associated with her skin tone for each image below:

3

Now, perhaps it was unfair to use Batman as a comparison as his character is more often depicted at night than is Wonder Woman—a fact which might mean he is more often depicted in dynamic lighting than she is. But it’s an interesting thought experiment.  Based on this sample, two things that seem immediately apparent:

  • Amazing-man is depicted much darker when his character is drawn angry.
  • And Wonder Woman exhibits the least color variation of the three.

Whether this is representative is beyond the scope of the post.  But, it’s an interesting question.  While we know that there are dramatically fewer women in comic books than men, inequality is not only a matter of numbers.  Portrayal matters a great deal as well, and color codes might be one way of considering getting at this issue in a new and systematic way.

While the hexadecimal ID of an individual pixel of an image is an objective measure of color, it’s also true that color is in the eye of the beholder and we perceive colors differently when they are situated alongside different colors. So, obviously, color alone tells us little about individual perception, and even less about the social and cultural meaning systems tied to different hexadecimal hues. Yet, as Wimberly writes,

In art, this is very important. Art is where associations are made. Art is where we form the narratives of our identity.

Beyond this, art is a powerful cultural arena in which we form narratives about the identities of others.

At any rate, it’s an interesting idea. And I hope someone smarter than me does something with it (or tells me that it’s already been done and I simply wasn’t aware).

Originally posted at Feminist Reflections and Inequality by Interior Design. Cross-posted at Pacific Standard. H/t to Andrea Herrera.

Tristan Bridges is a sociologist of gender and sexuality at the College at Brockport (SUNY).  Dr. Bridges blogs about some of this research and more at Inequality by (Interior) Design.  You can follow him on twitter @tristanbphd.

We’ve highlighted the really interesting research coming out of the dating site OK Cupid before. It’s great stuff and worth exploring:

All of those posts offer neat lessons about research methods, too. And so does the video below of co-founder Christian Rudder talking about how they’ve collected and used the data. It might be fun to show in research methods classes because it raises some interesting questions like: What are different kinds of social science data? How can/should we manipulate respondents to get it? What does it look like? How can it be used to answer questions? Or, how can we understand the important difference between having the data and doing an interpretation of it? That is, the data-don’t-speak-for-themselves issue.

Lisa Wade, PhD is an Associate Professor at Tulane University. She is the author of American Hookup, a book about college sexual culture; a textbook about gender; and a forthcoming introductory text: Terrible Magnificent Sociology. You can follow her on Twitter and Instagram.

Flashback Friday.

I recently came upon the Jewish greeting card section at Target, way down on the bottom row. I could tell it was the Jewish section because all of the dividers that tell you what kind of card is in that slot (birthday, anniversary, etc.) had a Star of David on them.

I was interested in what a specifically Jewish birthday card might look like, so I picked this one up. It draws on the idea that Jewish people are particularly prone to feeling guilty.


The inside said:

…but is cake and ice cream mentioned anywhere? I think NOT! It’s your day! Enjoy! Enjoy!

Mary Waters found that people often believe that ethnicity explains all types of behaviors that are in fact very widespread. She interviewed White ethnics in the U.S.; they often attributed their families’ characteristics to their ethnicity. Take the idea of the loud, boisterous family, often including a mother who is constantly trying to get the kids to eat more of her homecooked meals and worrying if they aren’t married. Many individuals described their family this way and claimed that their ethnicity was the reason.

People who identified their background as Italian, Greek, Jewish, Polish, and others all believed that the way their family interacted was a unique custom of their ethnic group. Yet they all described pretty much the same characteristics. The cardmakers’ (and others’) allusion to guilt to signify Jewishness seems to me to fall into this category: take out the Stars of David and I bet a range of religious/ethnic groups would think it was tailored to them specifically.

So you take a card, say guilt in it, add a Star of David, and you’ve got a Jewish card. Take out the Star of David, maybe it’s a Catholic card, especially if you added a cross, since they’re often portrayed as feeling a lot of guilt. I’ve had friends who grew up Southern Baptist or Pentecostal joke about having felt guilty about everything, so you could market the card to them, too! I think it’s a good example of how we often treat characteristics or behaviors as somehow meaningfully connected to a specific ethnic background rather than being a pretty common way that people in general, across ethnic lines, behave.

Originally published in 2010.

Gwen Sharp is an associate professor of sociology at Nevada State College. You can follow her on Twitter at @gwensharpnv.

On average, white and black Americans have different ideas as to what’s behind the recent unrest in Ferguson and Baltimore. A Wall Street Journal/NBC poll of 508 adults found that nearly two-thirds of African Americans felt that the unrest reflected “long-standing frustrations about police mistreatment of African Americans,” compared to less than one-third of whites.

2 (1)

In contrast, among whites, 58% believed that African Americans were just looking for an “excuse to engage in looting and violence.” A quarter of black respondents thought the same.

Though they may see it differently, almost everyone expects the uprising to reach more cities over the summer.

Lisa Wade, PhD is an Associate Professor at Tulane University. She is the author of American Hookup, a book about college sexual culture; a textbook about gender; and a forthcoming introductory text: Terrible Magnificent Sociology. You can follow her on Twitter and Instagram.

Black people in the U.S. vote overwhelmingly Democratic. They also have, compared to Whites, much higher rates of infant mortality and lower life expectancy. Since dead people have lower rates of voting, that higher mortality rate might affect who gets elected. What would happen if Blacks and Whites had equal rates of staying alive?

1b

The above figure is from the recent paper, “Black lives matter: Differential mortality and the racial composition of the U.S. electorate, 1970-2004,” by Javier Rodriguez, Arline Geronimus, John Bound and Danny Dorling.  A summary by Dean Robinson at the The Monkey Cage summarizes the key finding.

between 1970 and 2004, Democrats would have won seven Senate elections and 11 gubernatorial elections were it not for excess mortality among blacks.

At Scatterplot, Dan Hirschman and others have raised some questions about the assumptions in the model. But more important than the methodological difficulties are the political and moral implications of this finding. The Monkey Cage account puts it this way:

given the differences between blacks and whites in their political agendas and policy views, excess black death rates weaken overall support for policies — such as antipoverty programs, public education and job training — that affect the social status (and, therefore, health status) of blacks and many non-blacks, too.

In other words, Black people being longer-lived and less poor would be antithetical to the policy preferences of Republicans. The unspoken suggestion is that Republicans know this and will oppose programs that increase Black health and decrease Black poverty in part for the same reasons that they have favored incarceration and permanent disenfranchisement of people convicted of felonies.

That’s a bit extreme.  More stringent requirements for registration and felon disenfranchisement are, like the poll taxes of an earlier era, directly aimed at making it harder for poor and Black people to vote.  But Republican opposition to policies that would  increase the health and well-being of Black people is probably not motivated by a desire for high rates of Black mortality and thus fewer Black voters. After all, Republicans also generally oppose abortion. But, purely in electoral terms, reducing mortality, like reducing incarceration, would not be good for Republicans.

Cross-posted at Montclair SocioBlog.

Jay Livingston is the chair of the Sociology Department at Montclair State University. You can follow him at Montclair SocioBlog or on Twitter.

Flashback Friday.

Adolf Hitler targeted the Jews in the Holocaust not simply out of hate, but for strategic reasons. Describing his plan to take over Germany, and then Europe, he wrote:

I scanned the revolutionary events of history and… [asked] myself: against which racial element in Germany can I unleash my propaganda of hate with the greatest prospects of success? …I came to the conclusion that a campaign against the Jews would be as popular as it would be successful.

Jews, Hitler figured, were already well hated and, thus, would lend themselves to demonization quite easily.

Once it was decided that the Jews would be targeted, wrote Ronald Berger writes in his essay The “Banality of Evil” Reframed:

the most immediate difficulty that confronted the Nazis was the construction of a legal definition of the target population.

Who was Jewish?

At first, the Nazis defined Jews as non-Aryan. But this became problematic because nations with whom Germany wanted to ally (e.g., Japan) were arguably non-Aryan.

So, the regime settled on a definition that linked non-Aryan-ness to religion. Both racial and religious characteristics could qualify one as “Jewish.”

Like the rules of hypodescent that separated black from white in the U.S. during and after slavery, the Nazis had rules as to what percentage of Jewish blood one needed to have to be truly Jewish. Berger explains that a Jew was defined as a person who was 3/4ths Jewish or more. The term mischling worked like the U.S. word mulatto to identify a person with mixed blood (in this case, someone who was 1/2 Jewish and also was married to a Jew or practiced Judaism).

The next step was measurement. In confusing cases, how could the Nazi’s prove that someone was Jewish or mischling? They developed instruments. These photographs (mine) are from a museum in Munich that has collected some of the instruments used to place a person on the Aryan/non-Aryan spectrum.

An instrument for measuring facial features:

4

Instruments for measuring skin, eye, and hair color:

6

Picture1

This is just one more example of the way in which racial categories are constantly being invented and reinvented, usually for reasons related to power. For others, see our recent post on the deracialization of Irish dance, the shifting meanings of Creole, and the way Census data collection changed race in an instant.

Originally posted in 2009.

Lisa Wade, PhD is an Associate Professor at Tulane University. She is the author of American Hookup, a book about college sexual culture; a textbook about gender; and a forthcoming introductory text: Terrible Magnificent Sociology. You can follow her on Twitter and Instagram.

When one thinks of American Chinatowns, they usually think of San Francisco and New York, but at one time the third largest Chinatown in the U.S. was in Louisiana. It’s story is an example of how economics and geopolitics shape the growth of ethnic enclaves.

After the American Civil War ended legalized slavery in the U.S., Southern planters faced the challenge of finding labor to work their crops. It was common to employ the same black men and women who had been enslaved, now as sharecroppers or wage laborers, but the planters were interested in other sources of labor as well.

At nola.com, Richard Campanella describes how some planters in Louisiana turned to Chinese laborers. Ultimately, they hired about 1,600 Chinese people, recruited directly from China and also from California.

This would be a doomed experiment. The Chinese workers demanded better working conditions and pay then the Louisiana planters wanted to give. There was a general stalemate and many of the Chinese workers migrated to the city.

By 1871, there was a small, bustling Chinatown just outside of the French quarter and, by the late 1930s, two blocks of Bourbon St. were dominated by Chinese businesses: import shops, laundries, restaurants, narcotics, and cigar stores (some of the migrants had come to the U.S. via Cuba). Campanella quotes the New Orleans Bee:

A year ago we had no Chinese among us, we now see them everywhere… This looks, indeed, like business.

Big Gee and Lee Sing, New Orleans 1937 (photo courtesy of nola.com):

2

Other residents, it seemed, welcomed the way the Chinese added color and texture to the city. Campanella writes that “New Orleanians of all backgrounds also patronized Chinatown.” Louis Armstrong, who was born in 1901, talked of going “down in China Town [and] hav[ing] a Chinese meal for a change.” Jelly Roll Morton mentioned dropping by to pick up drugs for the sex workers employed in the nearby red light district.

A strip club now inhabits the old Chinese laundry; none of the original Chinatown businesses remain. But it held on a long time, with a few businesses lasting until the 1990s. All that’s left today is a hand-painted sign for the On Leong Merchants Association at 530 1/2 Bourbon St.

13

For more, get Richard Campanella’s book, Geographies of New Orleans.

Cross-posted at Pacific Standard.

Lisa Wade, PhD is an Associate Professor at Tulane University. She is the author of American Hookup, a book about college sexual culture; a textbook about gender; and a forthcoming introductory text: Terrible Magnificent Sociology. You can follow her on Twitter and Instagram.

African Americans are less healthy than their white counterparts. There are lots of causes for this: food deserts, lack of access to healthcare, an absence of recreational opportunities in low income neighborhoods, and more. Arguably, these are indirect effects of racist individuals and institutions, leading to the disinvestment in predominantly black neighborhoods and the economic disempowerment of black people.

This post, though, is about a direct relationship between racism and health mediated by stress. Experiencing discrimination has been shown to have both acute and long-term effects on the body. Being discriminated against changes the biometrics that indicate stress and personal reports of stress (anxiety, depression, and anger). Bad health outcomes are the result.

A new study, published in PLOS One, adds another layer to the accumulating evidence. To get a strong measure of “area racism” — the prevalence of racist beliefs in a specific geographic area — epidemiologist David Chae and his colleagues counted how often internet users searched for the “n-word” on Google (ending in -er or -ers, but not -a or -as). This, they argued, is a good measure of the likelihood that an African American will experience discrimination. Here are their findings for area racism:

2

They then measured the rate at which black people over 25 in those areas die and the death rate from the four most common causes of death for that population: heart disease, cancer, stroke, and diabetes. They also included a series of control variables to attempt to isolate the predictive power of area racism.

The resulting data offer support for the idea that area racism increases mortality among African Americans. Chae and his colleagues summarize, saying that areas in which Google searches for the n-word are one standard deviation above the mean have an 8.2% increase in mortality among Blacks. The searches were related, also, to an increase in the rates of cancer, heart disease, and stroke. “This,” they explain, “amounts to over 30,000 [early] deaths among Blacks annually nationwide.”

When they controlled for area level demographics and socioeconomic variables, the magnitude of the effect dropped from 8.2% to 5.7%. But these factors, they argued, “are also influenced by racial prejudice and discrimination and therefore could be on the causal pathway.” In other words, it’s not NOT racism that’s making up that 2.5% difference.

Directly and indirectly, racism kills.

H/t to Philip Cohen for the link. Cross-posted at Pacific Standard.

Lisa Wade, PhD is an Associate Professor at Tulane University. She is the author of American Hookup, a book about college sexual culture; a textbook about gender; and a forthcoming introductory text: Terrible Magnificent Sociology. You can follow her on Twitter and Instagram.