race/ethnicity: Blacks/Africans

In “Portraying Tiger Woods: Characterizations of a ‘Black’ Athlete in a ‘White’ Sport,” Andrew Billings discusses how race plays a role in sports commentators’ evaluations of golfers, and particularly in how they describe and comment upon Tiger Woods. A content analysis of 37.5 hours of coverage of golf tournaments between April and August of 2001 by CBS, NBC, and ABC, during which 2,989 evaluative comments occurred, revealed patterns in how sportscasters described Tiger Woods compared to other golfers. When he was losing, Woods was more likely than other golfers in the same position to be described as lacking composure or concentration, of “self-destructing,” and of lacking control over his emotions. Overall, Billings found that the types of language other students have found to be applied to Black athletes were applied to Woods only when he was losing. When he was doing well, commentators did not significantly stereotype Woods.

The study is interesting in light of a video sent in by Jason Eastman. This Wall Street Journal segment discusses the results of a study that investigated how media depictions of college quarterbacks’ performances. A recent study published in the Academic of Management Journal found that media coverage rarely gave African American quarterbacks credit for leadership. When their teams do well, it is because of their natural athletic talent; when they do poorly, it is lack of leadership — blame not equally placed on White quarterbacks when their teams do poorly. So Blacks are blamed more for losses but get less credit for successes — an outcome of stereotyping that has disturbing implications for hiring and promotion in the workplace (sorry for the ad):

Full cites:

Andrew Billings. 2003. “Portraying Tiger Woods: Characterizations of a ‘Black’ Athlete in a ‘White’ Sport.” The Howard Journal of Communications 14: 29-37.

Andrew Carton and Ashleigh Shelby Rosette. 2011. “Explaining Bias against Black Leaders: Integrating Theory on Information Processing and Goal-Based Stereotyping.” Academy of Management Journal 54: 1141-1158.

Since outright hatred and discrimination of people because of their race is no longer socially acceptable in our post Civil-Rights era, many argue racism no longer exists.  But sociologists suggest that racism simply changed, becoming more implicit and indirect.

Eduardo Bonilla-Silva argues that the new racism entails individuals saying and doing things that perpetuate racial stereotypes and inequalities, but they do so in such a way that the offender is able to deny being explicitly racist.  One of the many types of new racist strategies Bonilla-Silva highlights is the use of racially charged code speak, or using indirect racial rhetoric and semantic moves to express an ideology that serves to reinforce white dominance over minorities.

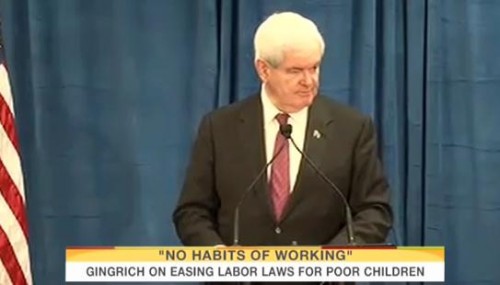
The Daily Show’s Larry Wilmore illustrates the code speak implicit in presidential candidate Newt Gingrich’s suggestion that we combat poverty by hiring poor children to clean the restrooms at their schools.  In the clip below, Wilmore notes that “it’s 2011, and you can’t just call Black people lazy,” and then points out Gingrich’s racial code speak.  He notes Gingrich’s statement about “neighborhoods where they may not have that experience [of working]” is “code for inner-city, which is code for urban, which is code for Black.”   Gingrich’s statement about poor children having “no habit of showing up [to work] on Monday” is “code for shiftless, which is code for lazy, which is code for black.” Wilmore then plays more of Gingrich’s speech where the presidential candidate cites statistics about Black unemployment, thereby making his implicit racial assumptions explicit:

.
The clip also points out how racial ideology engages very different explanations for the causes of poverty depending on the race of those affected.  Wilmore notes, “when Black people are poor it’s their fault because they are lazy and on welfare, but down in poor Appalachia it’s not your fault; it’s China’s fault, or India’s fault, or all the money we’re spending on Black people on welfare.”

When John Stewart asks why this is important, Wilmore points out how the causes of poverty “matter to the solutions,” thereby pointing out Gingrich’s implicit prejudices of nonwhite inferiority with his proposal that Black poverty could be eliminated by hiring children to clean toilets (and Gingrich reaffirmed his support for this idea at a GOP primary debate last week, to wild crowd applause). Similarly, Rick Santorum is now defending himself after saying, “I don’t want to make black people’s lives better by giving them somebody else’s money,” ignoring the fact that most recipients of government aid are White and the vast majority of Blacks are employed and do pay taxes to support the social safety net citizens of all races use. In both cases, the message is clear: African Americans are deficient, with no work ethic, and the solution to poverty is entirely at the individual level, with no need for larger structural changes.

—————————-

Jason Eastman is an Assistant Professor of Sociology at Coastal Carolina University who researches how culture and identity influence social inequalities.

If you would like to write a post for Sociological Images, please see our Guidelines for Guest Bloggers.

Another example, forwarded by Aaron P., of the trivialization of holidays meant to celebrate the triumphs of the marginalized:

Lisa Wade, PhD is an Associate Professor at Tulane University. She is the author of American Hookup, a book about college sexual culture; a textbook about gender; and a forthcoming introductory text: Terrible Magnificent Sociology. You can follow her on Twitter and Instagram.

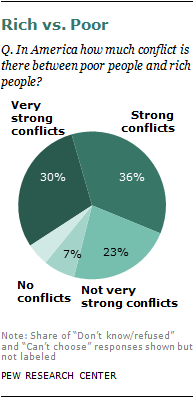
Recently the Pew Research Center released the results of a survey of 2,048 individuals about their perceptions of class conflict in the U.S., which are quite interesting in light of the Occupy Wall Street protests and the current attacks on Mitt Romney’s work with Bain Capital, which wouldn’t be that surprising except that they’re coming from other GOP presidential hopefuls (including Rick Perry referring to “vulture capitalism”). In the Pew survey, 2/3 of participants reported that there are “strong” or “very strong” conflicts between the rich and poor, with only 7% saying there are no conflicts:

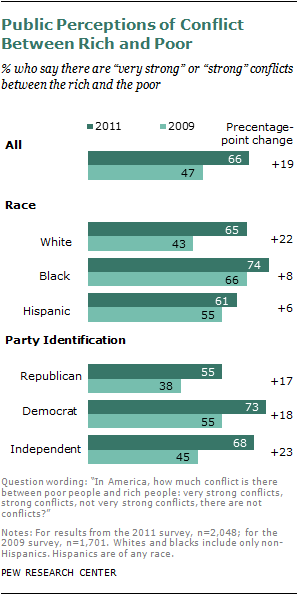
This indicates an increase in perceived class conflict since 2009, where under half said there were “strong” or “very strong” conflicts between rich and poor. We also some difference by race, with African Americans perceiving more conflict than Whites or Hispanics, and Democrats and Independents seeing more than Republicans:

While I think these findings are interesting, I’m also struck by the language. Since Americans tend to define themselves as middle class, regardless of income, the wording here (“rich” vs. “poor”) would seem to ask Americans about their perceptions of conflict between groups that they likely do not identify with personally (though many may interpret “rich vs. poor” as shorthand for general economic inequality, of course). I just wonder what the results would be if we had a survey that asked about conflicts between the rich and the middle class, or “the rich and people like you” (and the same questions about the poor).

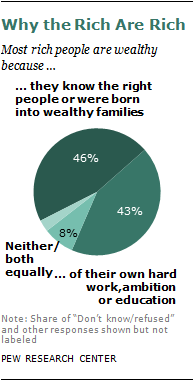
Regardless, increasing perceptions of class-based conflict doesn’t mean respondents necessarily think the wealthy are unfairly well-off. They were almost evenly split on whether the rich got their wealthy because of connections (family or otherwise) or because of their own hard work and effort:

The NYT has an article about the survey as well, with additional graphics. Thanks to Shamus Khan for the tip!

With the college football championship games coming up, Dmitriy T.M. thought it was a good time to highlight the NCAA’s database that provides detailed information on graduation rates of college athletes. For each school, you can select particular sports and years. I decided to look up graduation rates for 2010-2011 at the two schools I attended: University of Oklahoma (undergrad) and University of Wisconsin-Madison (grad school).

The database reports two numbers. The Federal Graduation Rate (FGR) reports numbers for individuals who were first-time college students when they enrolled at the institution (that is, no transfer students are included, and students who transfer count negatively in the rate for their initial school, the equivalent of a drop-out); the FGR indicates how many students graduated from their initial institution within 6 years. The Graduation Success Rate (GSR) takes into account transfer students; as long as they’re in good academic standing when they transfer, they aren’t counted against the initial school’s graduation rate.

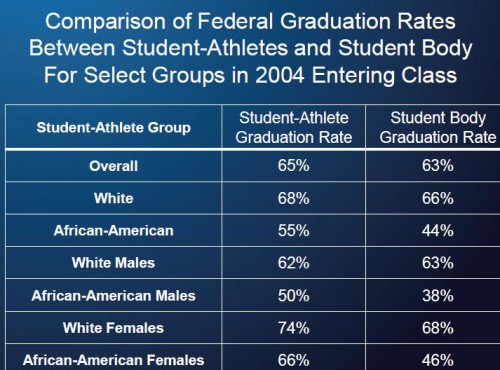
So how are student athletes doing? According to the NCAA’s analysis, if we look at the  more restrictive FGR for students who began college in 2004, student athletes actually have higher graduation rates in general, especially for African Americans:

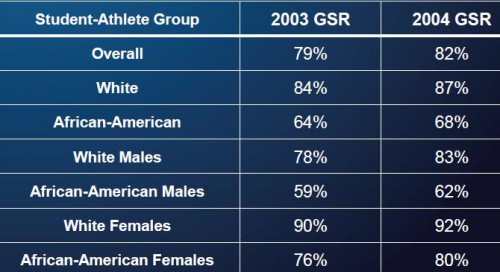
If we switch to looking at the GSR (which, again, drops transfers from the data for the initial school, rather than counting them as non-graduates), for students who began college in 2003 and 2004, overall graduation was pretty high (79 and 82 percent), but we see pretty wide disparities. White student athletes were significantly more likely to graduate than African Americans, and for both races, women were more likely to graduate than men:

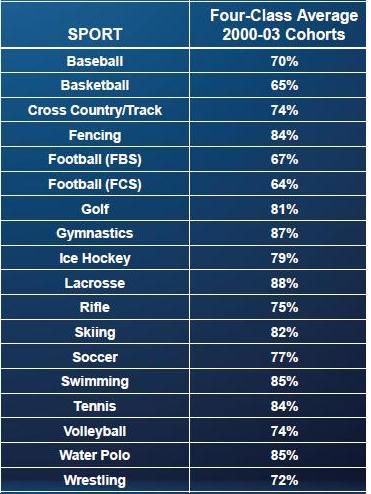
Graduation rates also vary by sport. Here are the averages for male athletes who enrolled between 2000 and 2003; we see basketball and football at the lower end, while lacrosse graduated 88% of its players from that period (the two football #s refer to the different divisions):


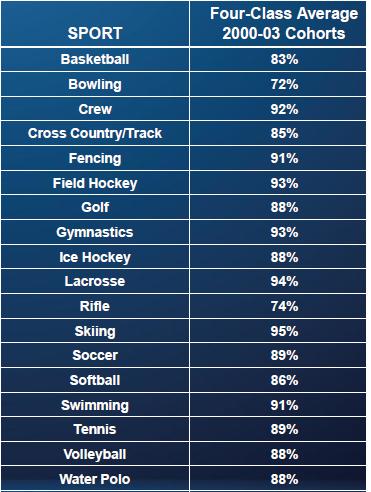
Female athletes from the same cohorts; the only sport where they didn’t have (usually significantly) higher graduation rates than men playing the same sport is rifle:

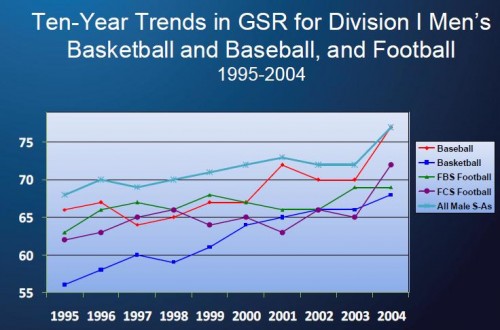
Ten-year trends for men in Division I schools in the “big three” sports:

There’s lots more detailed info available if you click the “Trends in Graduation Success Rates and Federal Graduation Rates at NCAA Division I Institutions” link at the top of the website; you can also get reports for particular schools broken down by sport, race/ethnicity, sex, etc.

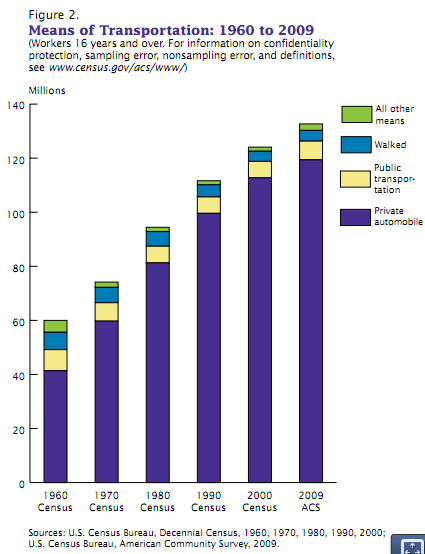
Dmitriy T.M. sent in a Census Bureau report on transportation and commuting, providing a detailed picture of how we’re getting to work. Despite constant discussions about reducing car use and encouraging mass transportation, the vast majority of people in the U.S. get to work in a car:

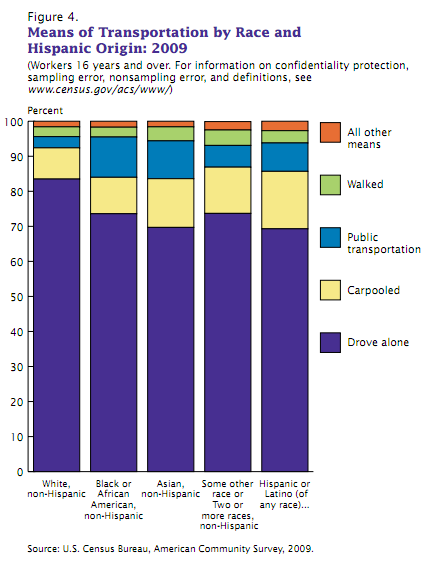
Not surprisingly, there are significant differences by race and ethnicity. Non-Hispanic Whites are the most likely to drive to work alone in their own car (83.5%), while only 3.2% use public transportation. Latinos are the most likely to carpool with at least one other person (16.4%) and African Americans are most likely to use public transportation (11.5%):

These differences likely reflect a variety of factors, include social class and differences in racial/ethnic concentrations in urban vs. rural areas and in different regions of the U.S., which affects how likely a worker is to have access to reliable, efficient public transportation or to realistically be able to walk to work. In fact, there were only five metro areas where at least 10% of workers use public transportation to get to work: the regions surrounding NYC, San Francisco/Oakland, Washington D.C., Boston, and Chicago.

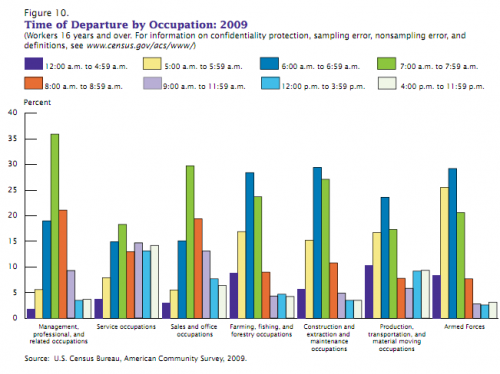
And as anyone who has taken part in a morning commute recently won’t be shocked to hear, leaving for work is still highly concentrated in the 5 to 8:59 a.m. period for most occupations, though departure times reflect the  wider range of normal working hours in the service industry compared to other economic sectors (note that the colors do not all represent equal amounts of time):

More on mode of transportation and commuting times by region and race/ethnicity in the full report.

Sonita M. sent in a report from the Movement Advancement Project about the state of lesbian, gay, bisexual, and transgender (LGBT) families.

LGBT families are more likely to be poor than non-LGBT families.  Nine percent of married cis-gender different-sex couples live in poverty, compared to 21% of gay male couples and 20% of lesbian couples:

LGBT couples may be more likely to be in poverty in part because of wage differentials between gays, lesbians, and their heterosexual counterparts.  Research shows that gay and bisexual men earn significantly less money than heterosexual men, whereas lesbians make somewhat more money than straight women.  Gay men would be more likely than heterosexual men to be in poverty, then.  But what about women? Women in same-sex couples face the same wage disadvantage that all women face, but also are not married to the heterosexual men that are making so much money (making it so that heterosexual women can make less money than gay women, but still be less likely to live in poverty). Make sense?  I hope so.

The second reason that LGBT couples with children are more likely than cis-gendered different-sex couples with children to live in poverty is that Black and Latino LGBT people are more likely than White LGBT people to be parents, and Blacks and Latinos are disproportionately poor to begin with:

Among same-sex couples, being a parent is also correlated with immigration status, which also correlates with class.  Non-citizens are more likely to be parents than citizens:


The two million children in America being raised by LGBT parents, then, are more likely to suffer from class disadvantage.  The authors of the report go on to discuss the ways in which formal policy and informal discrimination contribute to this state of affairs.

Via Andrew Sullivan.

Lisa Wade, PhD is an Associate Professor at Tulane University. She is the author of American Hookup, a book about college sexual culture; a textbook about gender; and a forthcoming introductory text: Terrible Magnificent Sociology. You can follow her on Twitter and Instagram.

Cross-posted at Jezebel.

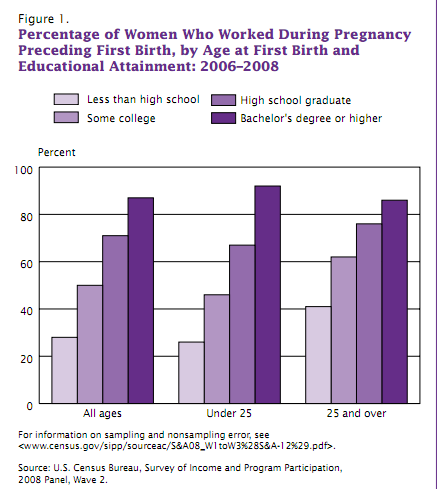
The U.S. Census Bureau recently released a report on employment and parental leave for first-time mothers. The mean age at first birth is now 25 years. And while a few decades ago the norm was for women to quit work upon getting pregnant, from 2006 to 2008, 56.1% of women worked full time during their pregnancy, leaving work only as the due date approaches. However, this varies widely by educational level, largely because women with the lowest levels of education are less likely to be working regardless:

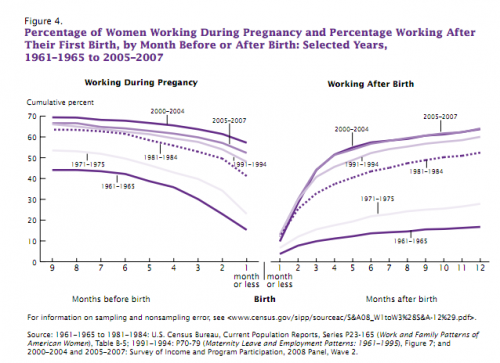
The graph on the left below shows how many months before the birth working women left their work; the graph on the left shows how many months after the birth they returned. As we see, over time women have stayed at their paid jobs longer and returned more quickly:

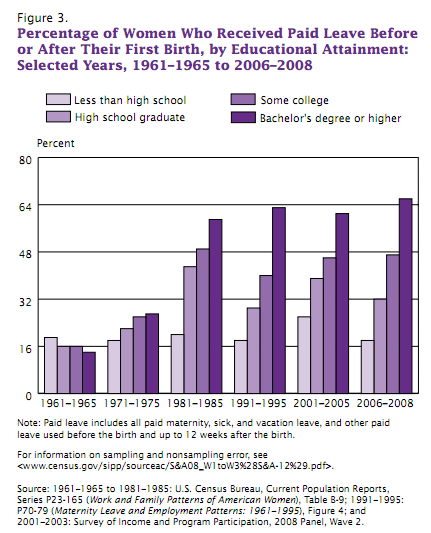
During the 2006-2008 reporting period, for the first time a majority — but a bare one, at 50.8% — of first-time mothers in the labor force used paid leave (maternity leave, sick days, etc.). Not surprisingly, access to paid leave also varied greatly by educational level, and that gap has widened significantly over time:

So nearly half of first-time mothers in the U.S. still do not have paid leave from their jobs.

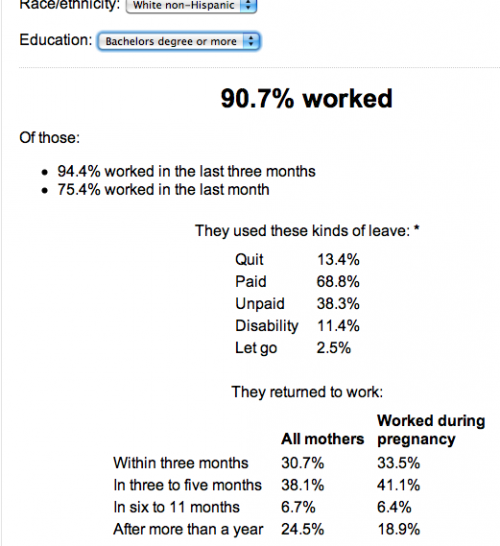
PBS created an interactive program based on the data that allows you to see the patterns more clearly. You select a race/ethnicity and educational level and get a detailed breakdown of the data. For instance, here’s the info for White non-Hispanic women with a 4-year college degree or higher: