race/ethnicity: American Indians/Aboriginals

Cross-posted at Pacific Standard.

Last week the U.S. Supreme Court struck down the part of the Voting Rights Act of 1965 that required states with a documenting history of discrimination to get federal approval before changing their voting laws.  When the law was passed in 1965, one of its main targets were “literacy tests.”

Ostensibly designed to ensure that everyone who voted could read and write, they were actually tools with which to disenfranchise African Americans and sometimes Latinos and American Indians.  Minority voters were disproportionately required to take these tests and, when they did, the election official at the polling place had 100% jurisdiction to decide which answers were correct and score the test as he liked.  The point was to intimidate and turn them away from the polls.  If this sounds bad, you should see the range of disturbing and terrifying things the White elite tried to keep minorities from voting.

The tactics to manipulate election outcomes by controlling who votes is still part and parcel of our electoral politics.  In fact, since most voters are not “swing” voters, some would argue that “turnout” is a primary ground on which elections are fought.  This is not just about mobilizing or suppressing Democrats or Republicans, it’s about mobilizing or suppressing the turnout of groups likely to vote Democrat or Republican.  Since most minority groups lean Democrat, Republicans have a perverse incentive to suppress their turn out. In other words, this isn’t a partisan issue; I’d be watching Democrats closely if the tables were turned.

Indeed, states have already moved to implement changes to voting laws that had been previously identified as discriminatory and ruled unconstitutional under the Voting Act.  According to the Associated Press:

After the high court announced its momentous ruling Tuesday, officials in Texas and Mississippi pledged to immediately implement laws requiring voters to show photo identification before getting a ballot. North Carolina Republicans promised they would quickly try to adopt a similar law. Florida now appears free to set its early voting hours however Gov. Rick Scott and the GOP Legislature please. And Georgia’s most populous county likely will use county commission districts that Republican state legislators drew over the objections of local Democrats.

So, yeah, it appears that Chief Justice John Roberts’ justification that “our country has changed” was pretty much proven wrong within a matter of hours or days.  This is bad.  It will be much more difficult to undo discriminatory laws than it was to prevent them from being implemented and, even if they are challenged and overturned, they will do damage in the meantime.

In any case, here are two examples of literacy tests given to (mostly) minority voters in Louisiana circa 1964.  Pages from history (from Civil Right Movement Veterans):

Louisiana circa 1964a Louisiana circa 1964bThanks to @drcompton for the tip!

Lisa Wade, PhD is an Associate Professor at Tulane University. She is the author of American Hookup, a book about college sexual culture; a textbook about gender; and a forthcoming introductory text: Terrible Magnificent Sociology. You can follow her on Twitter and Instagram.

Cross-posted at The Atlantic and Family Inequality.

The Census Bureau has a new report on nonmarital births. Based on the American Community Survey — the largest survey of its kind, and the only one big enough to track all states — the report shows that 35.7 percent of births in 2011 were to unmarried mothers.

Beneath the headline number, two patterns in the data will receive a lot of attention: education and race/ethnicity. I have a brief comment on both patterns.

Education

The education patterns show a very steep dropoff in nonmarital births as women’s education increases. From 57 percent unmarried among those who didn’t finish high school to just nine percent among those who have graduated college.

1

Given the hardships faced by single mothers (especially in the United States), it looks like women with more education are making the more rational decision to avoid childbearing when they’re not married. And I don’t doubt that’s partly the explanation. But we need to think about marriage, education and childbearing as linked events that unfold over time. The average high-school dropout mother was 26, while the average college-graduate mother was 33. Delaying childbearing and continuing education are decisions that are made together, based on the opportunities people have. And completing more education increases both the likelihood of marriage and the earning potential of one’s spouse.

So I think you could tell the story like this: Women with better educational opportunities delay childbearing, which increases their marriage prospects, and makes it more likely they will be married and financially better off when they have children in their 30s.

Race/Ethnicity

The differences in nonmarital birth rates between race/ethnic groups in the U.S. are shocking, from about two-thirds for black and American Indian women to 29 percent for whites and 11 percent for Asians.

2

This pattern is related to the education trend, naturally, but that’s not the whole story. One aspect of the story is race/ethnic geography of opportunity in this country. I’ve written before about the shortage of employed men available for women to marry, a particular expression of racial disparity first popularized by sociologist William Julius Wilson a quarter century ago.

Using the new numbers on nonmarital birth rates for each state from the Census report, I compared them to the male non-employment rate — specifically, the percentage of unmarried men ages 22-50 that are not currently employed. Here’s the relationship:

3

The states with more single men out of work have higher rates of nonmarital births. Single mother, meet jobless man.

My conclusion from these patterns is that unmarried parenthood is primarily a symptom of lack of opportunity, especially for education and employment. Surely that’s not the whole story. Maybe we should be persuading people to marry younger or shaming them into avoiding parenthood. But I think those approaches increase stigma more than they change behavior or improve wellbeing — Pew surveys show that 77 percent of people already say raising a family is easier if you’re married and only 12 percent of single people say they don’t want to marry. So who needs convincing? Meanwhile, if we addressed the problems of education and employment, is there any doubt family security and stability would improve, and with it the wellbeing of children and their parents?

Philip N. Cohen is a professor of sociology at the University of Maryland, College Park, and writes the blog Family Inequality. You can follow him on Twitter or Facebook.

Originally posted in 2008. Re-posted in honor of Women’s History MonthCross-posted at Racialicious.

The marketing for beach-related vacation destinations often capitalizes on the association of foreign beaches with (partly) naked bathing beauties. This intersection of race, gender, and sexuality that positions the “ethnic” woman as particularly sexually accessible have deep roots in our colonial past in which foreign lands “open” to conquest by the Western world were conflated with foreign women “open” to conquest by Western men.

The “Hula Girl” is a case in point.

Hawaii was colonized by the U.S. and, when the islands became a tourism destination, Polynesian women were transformed into Hawaiian babes ready and waiting to please tourists from the mainland.

One transformation was the hula. Widely understood to be an “authentic” Polynesian tradition, the hula was actually originally mostly a man’s dance. It was religious. It involved chanting and no music. There were no hip movements, just gestures. Basically, it was story-telling.

Today, the men take a back seat to women, who are scantily clad in grass skirts (not authentic, by the way), and perform exaggerated hip movements to music. So the hula is an invention, designed by colonizers and capitalists, to highlight the appeal of “foreign” women.

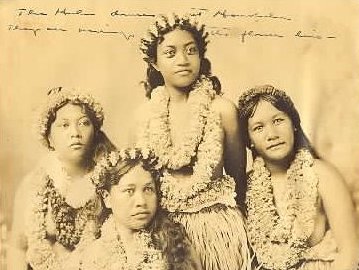
Despite the constructed nature of the hula girl, she’s been used to market Hawaii for over 100 years.  Here is an image of hula girls sent back to the mainland way back in 1890:

And from the 1940s (from IslandArtCards):

1

1965, via Jassy-50:

1

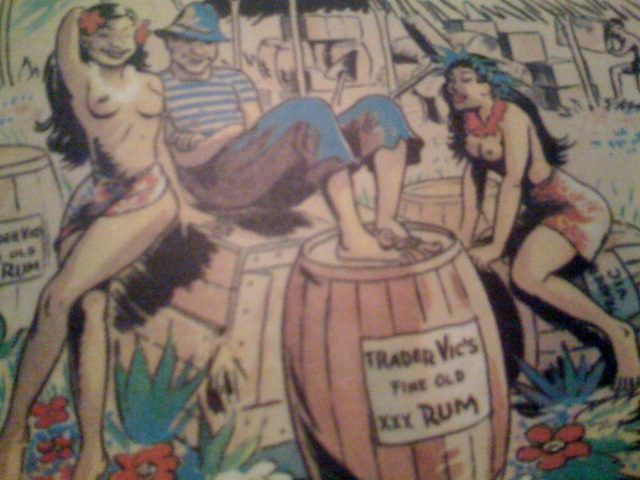
This picture was snapped by my friend Jason at a Trader Vic’s restaurant in 2008:

A Google Image search for “Hawaii postcard” in 2013 reveals that about half include the figure of a woman:

1

The phenomenon is a common one: women are treated as objects of beauty and aesthetic pleasure — exotified, in the case of “foreign” or darker-skinned women — and used to embellish a place or experience.  While lots of things have changed for women since the beginning of this particular example in the late 1800s, their role as decoration resists retirement.

Lisa Wade, PhD is an Associate Professor at Tulane University. She is the author of American Hookup, a book about college sexual culture; a textbook about gender; and a forthcoming introductory text: Terrible Magnificent Sociology. You can follow her on Twitter and Instagram.

Cross-posted at Native Appropriations.

Florida State has been the “Seminoles” since 1947, and have had a “relationship” with the Seminole Tribe of Florida for many years, but it was solidified more recently. In 2005, the NCAA passed a resolution, calling Native American Mascots “hostile and abusive,” and prohibiting schools with these mascots from hosting post-season events. The Seminole Tribe of Florida then officially gave their permission to use Osceola as the mascot, letting FSU get a waiver from the NCAA rule.

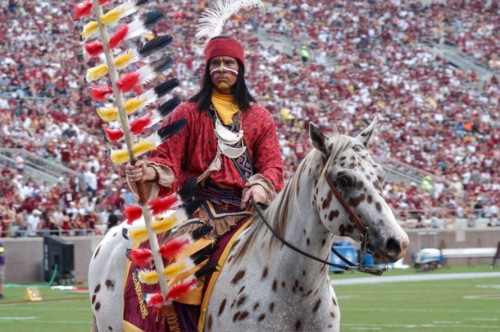
Disclaimer, and a big one — I am not Seminole, and I don’t want to speak for the tribe. I am offering my interpretation and perspective, but it’s just mine. I am going to be up front and say that I don’t agree with the choice to give the university permission to mock Native culture (see the billboard and video I posted earlier), and I don’t find a “stoic” dude in a wig and redface throwing a flaming spear“honoring” (see photo above), and I definitely don’t think that the “war chant” is respectful in any way. In fact I find it quite “hostile and abusive.”

I do want to put the decision of the tribe into context, however. From what I understand, prior to the formalized relationship with the tribe in the 1970′s, the image of the university was not Osceola (who is a real person, in case you didn’t know. Though the image is the profile of a white faculty member), but a stereotypical mis-mash named “Sammy Seminole” who was accompanied by “Chief Fullabull,” both of whom wore cartoonish and stereotypical outfits and clowned around at games. Trying to be more “sensitive” they changed “Fullabull” to “Chief Wampumstompum.” I’m not kidding. Osceola and Renegade (the horse) were introduced in the late 70′s.

So, by entering into a relationship with the university, the mascot now represents an actual Seminole figure, and wears (close to) traditional Seminole regalia, made by tribal members. In addition to control and “collaboration” over how the image is used and portrayed, I’ve heard the tribe gets a cut of the merchandising profits, which I’m sure is no small amount of money. The president of the university also established full scholarships for Seminole students (though only 8 Seminole students have graduated in the history of the school), a Seminole color guard brings in the flag at commencement, and the tribe was recently honored at homecoming. The Seminole of FL are also one of the most successful gaming tribes in the US, and my personal opinion is that keeping the state happy on the FSU front can only be good for relations around gaming contracts.

In summary, while the mascot is far from being respectful in my opinion, at least the tribe is gaining both economic and social benefits from engaging in this relationship. At least, at the games, as the student section is tomahawk chopping and yelling “scalp ‘em”, they can look down at the field and see a real Seminole every once and awhile to counter the image of Osceola. But is it perfect? Of course not. In a lot of ways it is similar to Derrick Bell’s theory of Interest Convergence — the idea that whites will only consent to racial progress when it benefits them directly — but turned around. The tribe is consenting to this, because they benefit directly. The interests of the two parties converge.

But the hard thing about FSU is that it always gives fodder to the mascot defenders. “But the Seminole approve of Florida State!  They don’t care!” Hopefully I’ve made a bit of a case as to why they’ve consented to have their image used, but I also want to point out that just because one faction of a marginalized group believes one thing, it doesn’t mean that everyone feels that way. Can you imagine if we expected all white folks to feel the same about a controversial issue… like gun control, for example? Not gonna happen. I also think that it ties back into the dilemma I’ve brought up again and again — is it better to be completely invisible as Native people, or be misrepresented? In the case of the Seminole tribe of Florida, they took the step to at least try and gain some control and power over how their people and community are represented.

For more, check out this awesome resource pulled together by Rob Schmidt of Blue Corn Comics/Newspaper Rock — offers more history, counter-arguments, quotes from news articles and Native scholars, and more: Why FSU’s Seminoles aren’t ok.

—————————

Adrienne Keene is a Cherokee doctoral candidate at the Harvard University Graduate School of Education, where she studies access to higher education for Native students.  She blogs about cultural appropriation at Native Appropriations.  You can follow her on Twitter and Facebook.

For the last week of December, we’re re-posting some of our favorite posts from 2012. Cross-posted at Global Policy TV and Pacific Standard.

Publicizing the release of the 1940 U.S. Census data, LIFE magazine released photographs of Census enumerators collecting data from household members.  Yep, Census enumerators. For almost 200 years, the U.S. counted people and recorded information about them in person, by sending out a representative of the U.S. government to evaluate them directly (source).

By 1970, the government was collecting Census data by mail-in survey. The shift to a survey had dramatic effects on at least one Census category: race.

Before the shift, Census enumerators categorized people into racial groups based on their appearance.  They did not ask respondents how they characterized themselves.  Instead, they made a judgment call, drawing on explicit instructions given to the Census takers.

On a mail-in survey, however, the individual self-identified.  They got to tell the government what race they were instead of letting the government decide.  There were at least two striking shifts as a result of this change:

  • First, it resulted in a dramatic increase in the Native American population.  Between 1980 and 2000, the U.S. Native American population magically grew 110%.  People who had identified as American Indian had apparently been somewhat invisible to the government.
  • Second, to the chagrin of the Census Bureau, 80% of Puerto Ricans choose white (only 40% of them had been identified as white in the previous Census).  The government wanted to categorize Puerto Ricans as predominantly black, but the Puerto Rican population saw things differently.

I like this story.  Switching from enumerators to surveys meant literally shifting our definition of what race is from a matter of appearance to a matter of identity.  And it wasn’t a strategic or philosophical decision. Instead, the very demographics of the population underwent a fundamental unsettling because of the logistical difficulties in collecting information from a large number of people.  Nevertheless, this change would have a profound impact on who we think Americans are, what research about race finds, and how we think about race today.

See also the U.S. Census and the Social Construction of Race and Race and Censuses from Around the World. To look at the questionnaires and their instructions for any decade, visit the Minnesota Population Center.  Thanks to Philip Cohen for sending the link.

Lisa Wade, PhD is an Associate Professor at Tulane University. She is the author of American Hookup, a book about college sexual culture; a textbook about gender; and a forthcoming introductory text: Terrible Magnificent Sociology. You can follow her on Twitter and Instagram.

Cross-posted at Kieran Healy’s blog.

The chart in “America is a Violent Country” has been getting a lot of circulation. Time to follow up with some more data. As several commentators at CT noted, the death rate from assault in the U.S. is not uniform within the country. Unfortunately, state-level and county-level mortality data are not easily available for the time period covered by the previous post — though they do exist, going back to the 1940s. What I have to hand is a decade’s worth of US mortality data courtesy of CDC WONDERcovering 1999 to 2009. I extracted the assault deaths according to the same criteria the OECD uses (for the time period in question, ICD-10 codes X85-Y09 and Y87.1). The estimates are adjusted to the 2000 U.S. population, which isn’t identical to the standard OECD adjustment. But the basic comparability should be OK, for our purposes.

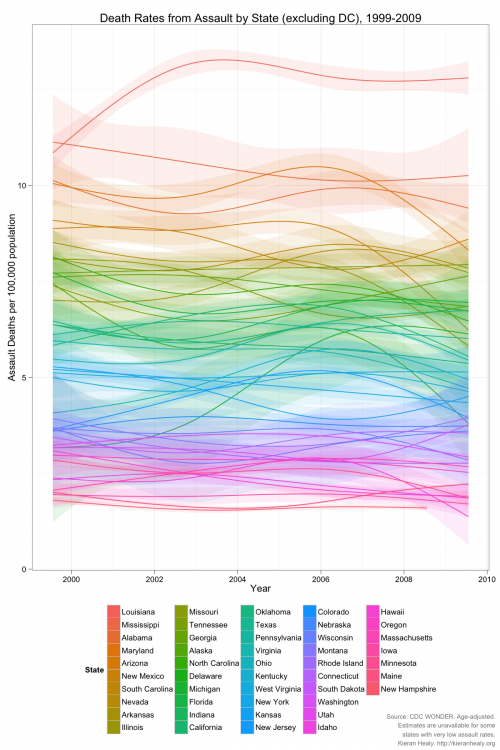
First, it’s well-known that there are strong regional differences in the assault death rate in the U.S. by state and region. Here’s what the patterns look like by state from 1999 to 2009 (click for a larger PNG or PDF):

This figure excludes the District of Columbia, which has a much higher death rate but is also a city. Also missing are a few states with small populations and low absolute numbers of assault deaths — Wyoming, North Dakota, Vermont — such that the CDC can’t generate reliable age-adjusted estimates for them. If you want a “small-multiple” view with each state shown separately from high to low, here you go.

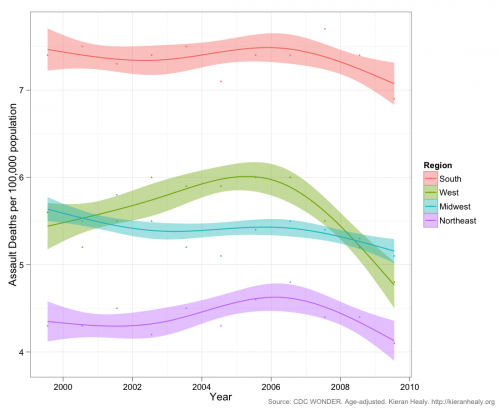
The legend for the figure above arranges the states from high to low, reading top to bottom and left to right. Although it’s clear that geographical region isn’t everything, those tendencies are immediately apparent. Let’s look at them using the official census regions (click for a larger PNG or PDF):

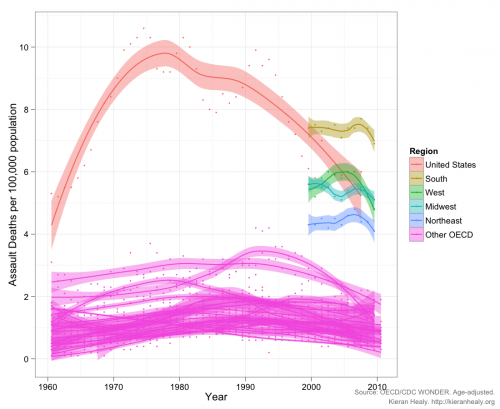
As is well known, the South is more violent than the rest of the country, by some distance. Given the earlier post, the natural thing to do is to put these regional trends into the cross-national comparison and see — for the decade we have, anyway — how these large U.S. regions would fare if they were OECD countries. Again, bear in mind that the age-adjustment is not quite comparable (click for a larger PNG or PDF):

Despite their large differences, all of the U.S. regions have higher average rates of death from assault than any of the 24 OECD countries we looked at previously. The placid Northeast comes relatively close to the upper end of the most violent countries in our OECD group.

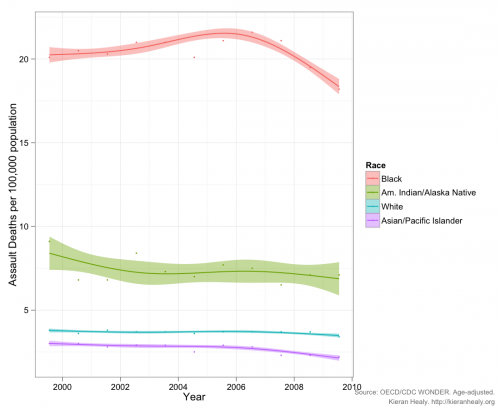
Finally, there’s the question of racial and ethic incidence of these deaths within the United States. Here are the decade’s trends broken out by the race of the victim, rather than by state or region (click for a larger PNG or PDF):

The story here is depressing. Blacks die from assault at more than three times the U.S. average, and between ten and twenty times OECD rates. In the 2000s the average rate of death from assault in the U.S. was about 5.7 per 100,000 but for whites it was 3.6 and for blacks it was over 20. Even 3.6 per 100,000 is still well above the OECD-24 average, which – if we exclude the U.S. – was about 1.1 deaths per 100,000 during the 2000s, with a maximum value of 2.9. An average value of 20 is just astronomical. And this is after a long period of decline in the death rate from assault.

—————————

Kieran Healy is a professor of sociology in the Kenan Institute for Ethics at Duke University.  His research is primary concerned with the moral order of a market society. You can follow him on twitter and at his blog.

As evidence of how mainstream and taken-for-granted dressing up like Native Americans for Halloween (not to mention as a general fashion trend) is, Kari sent in this photo of a costume store, where Native American is a sufficiently popular costume category that it deserves prominent signage:

Via Yo, Is This Racist?

Gwen Sharp is an associate professor of sociology at Nevada State College. You can follow her on Twitter at @gwensharpnv.

***TRIGGER WARNING for racism and enslavement***

During a dark period of world history, intellectuals pondered where to draw the line between human and animal.  They arrayed humans hierarchically, from the lightest to the darkest skin.  Believing that Africans were ape-like, they weren’t sure whether to include apes as human, or Africans as apes.

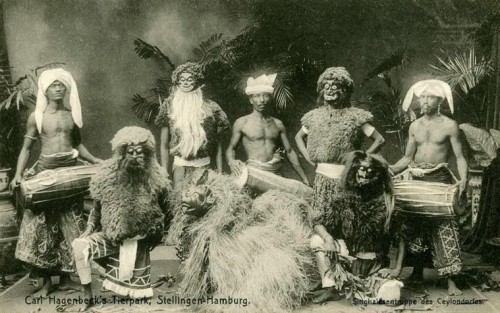
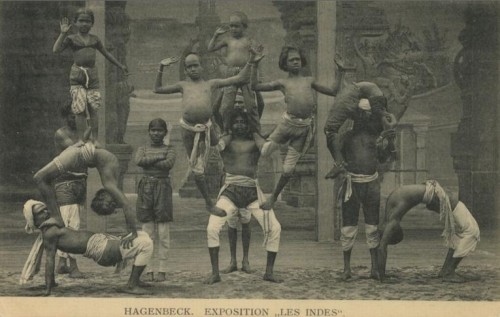
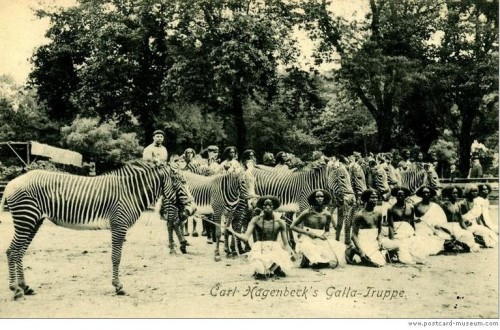
One artifact of this thinking was the “human zoo.”  Kidnapped from their homes at the end of the 19th century and into the next, hundreds of indigenous people were put on display for white Westerners to view.  “Often they were displayed in villages built in zoos specifically for the show,” according to a Spiegel Online sent in by Katrin, “but they were also made to perform on stage for the amusement of a paying public.”  Many died quickly, being exposed to diseases foreign to them.

This group of captives is from Sri Lanka (called  Ceylon at the time):

This photograph commemorates a show called “Les Indes,” featuring captives from India:

These captives are from Oromo in Ethiopia:

A German named Carl Hagenbeck was among the more famous men involved in human zoos.  He would go on expeditions in foreign countries and bring back both animals and people for European collections.  In his memoirs, he spoke of his involvement with pride, writing: “it was my privilege to be the first in the civilized world to present these shows of different races.”

The zoo in Hamburg still bears his name.

Lisa Wade, PhD is an Associate Professor at Tulane University. She is the author of American Hookup, a book about college sexual culture; a textbook about gender; and a forthcoming introductory text: Terrible Magnificent Sociology. You can follow her on Twitter and Instagram.