nation: United States

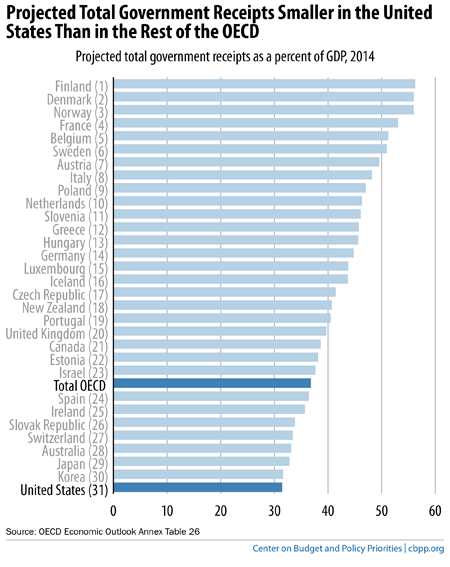
This chart comes from Chuck Marr at the Center on Budget and Policy Priorities.  As Marr explains:

The United States is a relatively low-tax country, as the chart shows.  When measured as a share of the economy, total government receipts (a broad measure of revenue) are lower in the United States than in any other member of the Organization for Economic Co-operation and Development (OECD), even after accounting for the modest revenue increases in the 2012 “fiscal cliff” deal and the taxes that fund health reform.

1 (2) - Copy

Martin Hart-Landsberg is a professor of economics at Lewis and Clark College. You can follow him at Reports from the Economic Front.

Each  year the National Priorities Project releases a visual illustrating how our tax dollars are spent.  This is the one for 2013, sans medicare and social security taxes.

1At the end of Sociology 101, I like to ask my students: “What is the state for?”  This often takes them aback, as most of them have never considered the question before.  Is it for defense?  It is to maximize happiness or reduce misery?  Is it for maximizing GDP?  Protecting private property?  Do we want to use it to influence other countries?  How?

There are many questions to ask and they are not purely theoretical.  I like how the spending of our tax dollars helps make the conversation more concrete.

Cross-posted at Business Insider.

Lisa Wade, PhD is an Associate Professor at Tulane University. She is the author of American Hookup, a book about college sexual culture; a textbook about gender; and a forthcoming introductory text: Terrible Magnificent Sociology. You can follow her on Twitter and Instagram.

On average, U.S. workers with jobs put in more hours per year  than workers in most OECD countries. In 2012, only Greece, Hungary, Israel, Korea, and Turkey recorded a longer work year per employed person.

2

A long work year is nothing to celebrate. The following chart, from the same Economist article, shows there is a strong negative correlation between yearly hours worked and hourly productivity.

3.5

More importantly, the greater the number of hours worked per year, the greater the likelihood of premature death and poor quality of life.  This reality is highlighted in the following two charts taken from an article by Angus Chen titled “8 Charts to Show Your Boss to Prove That You Can Do More By Working Less.”

1 (2) - Copy

1 (2)

In sum, we need to pay far more attention to the organization and distribution of work, not to mention its remuneration and purpose, than we currently do.

Martin Hart-Landsberg is a professor of economics at Lewis and Clark College. You can follow him at Reports from the Economic Front.

By now most readers are likely familiar with the idea that the American middle class is shrinking.  Most income and wealth gains over the past 40 or so years have gone to the richest Americans, while poverty is spreading and getting deeper.  As a result, the percent of Americans who can reasonably claim to be middle class is shrinking.

I found a fantastic animation illustrating this process in the neighborhoods of the city of Chicago.  Borrowing data from education scholar Sean Reardon and sociologist Kendra Bischoff, Daniel Hertz calculated where the  median family income of each Census tract fell relative to the entire metropolitan area.  Orange tracts are ones where the median family income is 0-45% of the median for Chicago as a whole (struggling families), dark green tracts are ones where the median is 200% or more (resource rich families).  Grey is, literally, middle class.

For simplicity’s sake, here is 1970 and 2012 right next to one another.  Notice that the 1970 map involves a lot more grey (middle class) and the 2012 map involves a lot more green (rich) and especially orange (poor).

1


Here’s the animation:

1For another interesting measure of the shrinking middle class, see our post showing increases in high paying and low paying jobs, but decreases in jobs that pay middle income wages.

Lisa Wade, PhD is an Associate Professor at Tulane University. She is the author of American Hookup, a book about college sexual culture; a textbook about gender; and a forthcoming introductory text: Terrible Magnificent Sociology. You can follow her on Twitter and Instagram.

1 (2) - Copy
U.S. Army celebrates “Hispanic Month” (source: wikimedia)

One may well wonder where the term “Hispanic,” and for that matter, “Latino,” came from. The press and pundits are all abuzz about the Hispanic vote, Hispanic organizations, and Hispanic cultural influences. Back in the mid-twentieth century, however, they wrote about Mexicans or Puerto Ricans or Guatemalans, not about Hispanics. Of course, people of Latin American origin have become far more numerous in the United States since then and the immigration itself brings more attention. Nonetheless, the labels have changed. Starting in the 1970s, the media rapidly adopted the “pan-ethnic” term Hispanic, and to a lesser degree, Latino, and slowed down their use of specific national labels.*  So did, organizations, agencies, businesses, and “Hispanics” themselves.

As recounted in her important new book, Making Hispanics, sociologist (and my colleague) G. Cristina Mora tells the story of how people as diverse as Cuban-born businessmen in Miami, undocumented Mexican farm workers in California, and third-generation part-Puerto Ricans in New York who do not even understand Spanish were brought together into one social category: Hispanic-Americans.

Politics, Business, and Government

Mora describes an alliance that emerged in the 1970s among grassroots activists, Spanish-language broadcasters, and federal officials to define and promote “Hispanic.”

Activists had previously stressed their national origins and operated regionally – notably, Mexicans in the southwest (where the term “Chicano” became popular for a while) and Puerto Ricans in the northeast. But the larger the numbers they could claim by joining together, the more political clout, the more governmental funds, and the more philanthropic support they could claim. Pumping up the numbers was particularly important given their latent competition with African-American activists over limited resources and limited media attention. Some pan-ethnic term promised to yield the biggest count.

Spanish-language television broadcasters, notably Univision, looked to expand their appeal to advertisers by delivering them a national market. Although the broadcasters faced obstacles in appealing to Spanish-language viewers across the country differing significantly in programming tastes and dialects, they managed to amalgamate the audiences by replacing content imported from abroad with content developed in the United States. They could then sell not medium-to-small Mexican-, Cuban-, or Puerto Rican-American audiences to advertisers, but one huge Hispanic-American audience.

Making the term official as a census category helped both activists and entrepreneurs. Previously, the Bureau of the Census classified Latin Americans as whites with distinct national origins, usually poorly measured. The activists pressed the census bureau, as did some politicians, to provide as broad a label as possible and count everyone who might conceivably fit the category, including, for example, the African-origin Dominicans (although not the French-speaking Haitians nor the Portuguese-speaking Brazilians). This pressure led to the 1980 formulation, used ever since, in which the census asks Americans whether or not they are “Hispanic” separately from whether they are white, black, Asian, or Indian.

Univision social media ad (source):

Univision-Social Media Ad

The three interest groups worked together to publicize and promote the idea and the statistical category of “Hispanic.” As Mora explains, leaving the label’s meaning somewhat ambiguous was useful in both expanding the numbers and in selling the category – as a large needy population to the government and as numerous, affluent consumers to advertisers. The three parties also campaigned to get other institutions, such as state vital statistics bureaus and big businesses to adopt Hispanic as an official category. Many so-called Hispanics preferred and still prefer to call themselves by their national origins; Mora quotes a 1990s bumper sticker, “Don’t Call Me Hispanic, I’m Cuban!” But the term has taken over.

And, so Hispanic-Americans matter a lot now.

Identities

Categories of people that we take to be fixed – for example, our assumptions that people are old or young, black or white, male or female – often turn out to be not fixed at all. Social scientists have documented the way the definition of Negro/African American/black has shifted over the generations. There was a time, for example, when the census bureau sought to distinguish octoroons and a time when it could not figure out how to classify people from the Indian subcontinent. In Making Hispanics, Mora lets us see close up just how this new category, Hispanic, that we now take to be a person’s basic identity, was created, debated, and certified.

Direct Marketing Ad

One lesson is that it could have been otherwise. If the pace and sources of migration had been different or if the politics of the 1970s had cut differently, maybe we would be talking about two separate identities, Chicano and “Other Spanish-speaking.” Or maybe we would be classifying the darker-skinned with “Blacks” and lighter-skinned with “Whites.” Or something else. Making Hispanics teaches us much about the social construction of identity.

* Based on my analysis of statistics on New York Times stories and the nGram data on words in American books. Use of “Chicano” surged in 1960s and 1970s, but then faded as “Latino” and, especially, “Hispanic” rose.

Claude S. Fischer is Professor of Sociology at the University of California, Berkeley and the author of Made in America: A Social History of American Culture and Character.  This post originally appeared at his blog of the same name.

There are now more people working as private security guards than high school teachers.

Samuel Bowles and Arjun Jayadev offer the following graph, highlighting the number of “protective service workers”* employed per 10,000 workers and the degree of income inequality in the year 2000 for 16 countries.  The United States is tops on both counts.

17greatdivide-img-tmagArticle-v3

Two things stand out from this graph beyond U.S. “leadership.”  The first is the relationship between the share of protective service workers  — or “guard labor” — and inequality.  As Bowles and Jayadev comment:

In America, growing inequality has been accompanied by a boom in gated communities and armies of doormen controlling access to upscale apartment buildings. We did not count the doormen, or those producing the gates, locks and security equipment. One could quibble about the numbers; we have elsewhere adopted a broader definition, including prisoners, work supervisors with disciplinary functions, and others.

But however one totes up guard labor in the United States, there is a lot of it, and it seems to go along with economic inequality. States with high levels of income inequality — New York and Louisiana — employ twice as many security workers (as a fraction of their labor force) as less unequal states like Idaho and New Hampshire.

When we look across advanced industrialized countries, we see the same pattern: the more inequality, the more guard labor. As the graph shows, the United States leads in both.

The second is the rapid rise in the U.S. share of guard labor and inequality from 1979 to 2000.

One can only wonder in what ways and for whom this large and growing dependence on guard labor represents a rational use of social resources.

* For those who like definitions: The category protective service workers includes those employed as Private Security Guards, Supervisors of Correctional Officers, Supervisors of Police and Detectives, Supervisors of all other Protective Service Workers, Bailiffs, Correctional Officers and Jailers, Detectives and Criminal Investigators, Fish and Game Wardens, Parking Enforcement Workers, Police and Patrol Officers, Transit and Railroad Police, Private Detectives and Investigators, Gaming Surveillance Officers, and Transportation Security Screeners.  A broader measure of guard labor might include members of the armed forces, civilian employees of the military, and those that produce weapons to those employed as protective service workers.  That total was 5.2 million workers in 2011.

Cross-posted at Reports from the Economic Front.

Martin Hart-Landsberg is a professor of economics at Lewis and Clark College. You can follow him at Reports from the Economic Front.

Thomas Piketty has just published a massive new book tackling the explosive growth in income inequality.  Here’s what it looked like in Europe and the United States in 2010 (source):
14
A New York Times review of the book, Capital in the Twenty-First Centurybegins as follows:

What if inequality were to continue growing years or decades into the future? Say the richest 1 percent of the population amassed a quarter of the nation’s income, up from about a fifth today. What about half?

To believe Thomas Piketty of the Paris School of Economics, this future is not just possible. It is likely…

His most startling news is that the belief that inequality will eventually stabilize and subside on its own, a long-held tenet of free market capitalism, is wrong. Rather, the economic forces concentrating more and more wealth into the hands of the fortunate few are almost sure to prevail for a very long time.

Piketty’s pessimistic view is based on his argument that income generated from capital normally grows faster than the economy or income from wages.  This means that the private owners of capital benefit disproportionately from growth, which makes it easier for them to increase their asset holdings and by extension future income.  And, since wealth and income translate into political power, we face a self-reinforcing dynamic leading to ever growing inequality.

This suggests that embracing a system based on maximizing the returns to private owners of capital is a mistake for the great majority of working people. A recent study by the investment bank Credit Suisse provides more evidence for this conclusion.  As Michael Burke explains,

The study… shows that long-term growth rates of GDP in selected industrialized economies are negatively correlated with financial returns to shareholders.

That is, the best returns for shareholders are from countries where GDP growth has been slowest, and vice versa. Where growth has been strongest, shareholder returns are weakest…

The negative correlation [seen in the chart below] does not prove negative causality. But it does support the theory which suggests that the interests of shareholders are contrary to the interests of economic growth and the well-being of the population.

mb

All this information is worth keeping in mind the next time business and political leaders tell us that the key to our well-being is boosting business confidence, the market, or private returns on investment.

Cross-posted at Reports from the Economic Front.

Martin Hart-Landsberg is a professor of economics at Lewis and Clark College. You can follow him at Reports from the Economic Front.

The narrative of the American Dream is one of upward mobility, but there are some stories of mobility we prize above others.  Who is more successful: a Mexican-American whose parents immigrated to the U.S. with less than an elementary school education, and who now works as a dental hygienist? Or a Chinese-American whose parents immigrated to the U.S. and earned Ph.D. degrees, and who now works as a doctor?

Amy Chua (AKA “Tiger Mom”) and her husband Jed Rubenfeld, author of the new book The Triple Package, claim it’s the latter. They argue that certain American groups (including Chinese, Jews, Cubans, and Nigerians) are more successful and have risen further than others because they share certain cultural traits. Chua and Rubenfeld bolster their argument by comparing these groups’ median household income, test scores, educational attainment, and occupational status to those of the rest of the country.

But what happens if you measure success not just by where people end up — the cars in their garages, the degrees on their walls — but by taking into account where they started? In a study of Chinese-, Vietnamese-, and Mexican-Americans in Los Angeles whose parents immigrated here, sociologist Min Zhou and I came to a conclusion that flies in the face of Chua and Rubenfeld, and might even surprise the rest of us: Mexicans are L.A.’s most successful immigrant group.

Like Chua and Rubenfeld, we found that the children of Chinese immigrants exhibit exceptional educational outcomes that exceed those of other groups, including native-born Anglos. In Los Angeles, 64 percent of Chinese immigrants’ children graduated from college, and of this group 22 percent also attained a graduate degree. By contrast, 46 percent of native-born Anglos in L.A. graduated from college, and of this group, just 14 percent attained graduate degrees. Moreover, none of the Chinese-Americans in the study dropped out of high school.

These figures are impressive but not surprising. Chinese immigrant parents are the most highly educated in our study. In Los Angeles, over 60 percent of Chinese immigrant fathers and over 40 percent of Chinese immigrant mothers have a bachelor’s degree or higher.

At what seems to be the other end of the spectrum, the children of Mexican immigrants had the lowest levels of educational attainment of any of the groups in our study. Only 86 percent graduated from high school — compared to 100 percent of Chinese-Americans and 96 percent of native-born Anglos — and only 17 percent of graduated from college. But their high school graduation rate was more than double that of their parents, only 40 percent of whom earned diplomas. And, the college graduation rate of Mexican immigrants’ children more than doubles that of their fathers (7 percent) and triples that of their mothers (5 percent).

There is no question that, when we measure success as progress from generation to generation, Mexican-Americans come out ahead.

A colleague of mine illustrated this point with a baseball analogy: Most Americans would be more impressed by someone who made it to second base starting from home plate than someone who ended up on third base, when their parents started on third base. But because we tend to focus strictly on outcomes when we talk about success and mobility, we fail to acknowledge that the third base runner didn’t have to run far at all.

This narrow view fuels existing stereotypes that Chua and Rubenfeld play into — that some groups strive harder, have higher expectations of success, and possess a unique set of cultural traits that propels them forward.

For at least a generation, Americans have been measuring the American Dream by the make of your car, the cost of your home, and the prestige of the college degree on your wall. But there’s a more elemental calculation: Whether you achieved more than the generation that came before you. Anyone who thinks the American Dream is about the end rewards is missing the point. It’s always been about the striving.

Jennifer Lee, PhD, is a sociologist at the University of California, Irvine. Her book, The Diversity Paradox, examines patterns of intermarriage and multiracial identification among Asians, Latinos, and African Americans.  

Cross-posted at Time and Zocalo Public Square.