nation: Sweden

An infographic accompanying an article at the New York Times reveals how “advanced economies” compare on various measures of equality, well-being, educational attainment, and more.  To illustrate this, for each measure countries that rank well are coded tan, countries that rank poorly and very poorly are coded orange and red respectively, and countries that are in the middle are grey.  The countries are then ranked from best to worst overall, with Australia coming in #1 and the United States coming in last.  You might be surprised how some of these countries measure up.

Thanks to Dmitriy T.M. for the link.

Lisa Wade, PhD is an Associate Professor at Tulane University. She is the author of American Hookup, a book about college sexual culture; a textbook about gender; and a forthcoming introductory text: Terrible Magnificent Sociology. You can follow her on Twitter and Instagram.

The United States is a nation of immigrants… in that the majority of its citizens are not part of the native population of North America.  In other words, because it was and remains a colonized land.

That aside, is the United States unique in receiving an extremely large number of new immigrants relative to its size?  It turns out, No.

Lane Kenworthy, at Consider the Evidence, posted this figure, showing that the U.S. population does indeed include a substantial proportion of first generation immigrants (both legal and illegal), but it is not unique in that regard, nor does it carry the highest percentage:

It also fails to be true, as many anti-immigration people claim, that the U.S. accepts a uniquely large number of immigrants who need help once they arrive:

Lisa Wade, PhD is an Associate Professor at Tulane University. She is the author of American Hookup, a book about college sexual culture; a textbook about gender; and a forthcoming introductory text: Terrible Magnificent Sociology. You can follow her on Twitter and Instagram.

Claude Fischer at Made in America offered some data speaking to the idea that Americans are especially patriotic. That they, in other words, are more likely than citizens of other nations to think that “We’re Number One!”

Fischer provides some evidence by Tom Smith at the International Social Science Programme (ISSP; Tom’s book).  The ISSP, Fischer explains…

…involves survey research institutions in dozens of countries asking representative samples of their populations the same questions. A couple of times the ISSP has had its members ask questions designed to tap respondents’ pride in their countries… One set of questions asked respondents how much they agreed or disagreed with five statements such as “I would rather be a citizen of [my country] than of any other country in the world” and “Generally, speaking [my country] is a better country than most other countries.”

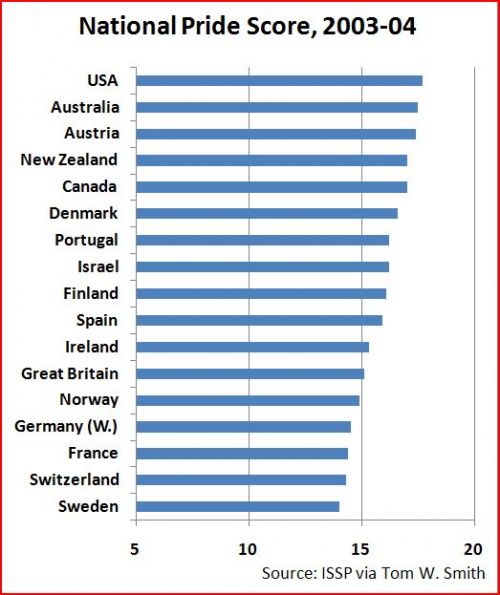
Smith put responses on a scale from 5 to 25, with 25 being the most patriotic.  Here are the results from some of the affluent, western democracies (on a shortened scale of 5 to 20):

As Fischer says, “Americans were #1 in claiming to be #1.”  Well, sort of.  Americans were the most patriotic among this group.  They turned out to be the second most patriotic of all countries.  Venezuela beat us.

(In any case, what struck me wasn’t the fact that the U.S. is so patriotic, but that many other of these countries were very patriotic as well!   The U.S. is certainly no outlier among this group.  In fact, it looks like all of these countries fall between 14 and 18 on this 20-point scale.  Statistically significant, perhaps, but how meaningful of a difference is it?)

Fischer goes on to ask what’s good and bad about pride and closes with the following concern for U.S. Americans:

We believe that we are #1 almost across the board, when in fact we are far below number one in many arenas – in health, K-12 education, working conditions, to mention just a few. Does our #1 pride then blind us to the possibility that we could learn a thing or two from other countries?

Lisa Wade, PhD is an Associate Professor at Tulane University. She is the author of American Hookup, a book about college sexual culture; a textbook about gender; and a forthcoming introductory text: Terrible Magnificent Sociology. You can follow her on Twitter and Instagram.


How have adults and young people weathered the worldwide economic downturn? This two-minute 12-second video shows that young people have been harder hit by joblessness in almost all OECD countries:

From the OECD Factblog.

Lisa Wade, PhD is an Associate Professor at Tulane University. She is the author of American Hookup, a book about college sexual culture; a textbook about gender; and a forthcoming introductory text: Terrible Magnificent Sociology. You can follow her on Twitter and Instagram.

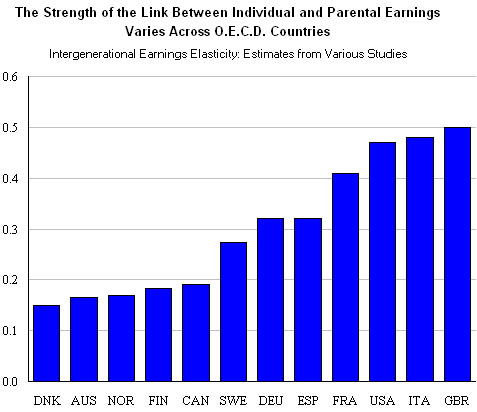
Katrin sent us a great figure comparing the rate of socioeconomic mobility across several OECD nations.  Using educational attainment and income as measures, the value (between zero and one) indicates how strongly parental socioeconomic status predicts a child’s socioeconomic status (a 1 is a perfect correlation and a zero would be no correlation).

The figure shows that Great Britain, the U.S., and Italy have a near 50% correlation rate.  So, in these countries, parents status predicts about 50% of the variance in children’s outcomes.  In contrast, Denmark, Australia, Norway, Finland, and Canada have much lower correlations.  People born in the countries on the left of this distribution, then, have higher socioeconomic mobility than people born in the countries on the right.  Merit, presumably, plays a greater role in your educational and class attainment in these cases.

Source:  The New York Times.

Lisa Wade, PhD is an Associate Professor at Tulane University. She is the author of American Hookup, a book about college sexual culture; a textbook about gender; and a forthcoming introductory text: Terrible Magnificent Sociology. You can follow her on Twitter and Instagram.

FiveThirtyEight has up an interesting article about the proportion of Republicans in the U.S. Congress who are women, as well as comparisons to conservative parties in several other countries. The U.S. data (note that, contrary to the usual color-coding, in these tables red = left and blue = right, and an * indicates it is the party in power):

women1

Now, one obvious explanation for this data would be that there aren’t that many women in the Republican party compared to the Democratic party, so there are accordingly fewer women in Congress (anyone have data on the gender breakdown by party, as opposed to voting in particular elections?). Or maybe they just can’t get elected. Another would be that parties on the right often encourage gender roles that are more “traditional,” with the idea that public life (particularly politics) is more appropriate for men, while women focus more on the private sphere of home life and extensions of it (say, education).

There may very well be some truth there, but that’s not the whole story. For one thing, the U.S. lags behind many other nations in terms of the percent of female legislators (a pattern that holds in the U.S. whether Republicans or Democrats control Congress, though the % changes somewhat):

women2

The FiveThirtyEight post also compares parties in Sweden, Japan, Germany, and the U.S. in terms of the representation of women in left- and right-leaning parties, based on data for the parties holding seats in the legislative bodies in each country.  In Sweden a center/right coalition is currently in power, while in Germany a left-leaning and right-leaning party have formed a coalition. A party on the left recently took power from a party on the left in Japan. A comparison of the four countries, broken down by political orientation:

women6

Of course, parties on the right and left in each nation have different platforms, policy emphases, bases of support, and gender ideologies, so they aren’t directly comparable. But the “proportion” column above compares left and right parties within each country; it reflects the % of right party legislators that is female compared to the % in more left-leaning parties. That is, if the parties on the political right had the same % of female legislators as parties on the political left in that country, the proportion would be 100.0%. The lower the proportion, the lower the % of female legislators on the right compared to their representation on the left.

As we see, there are clear differences by political orientation in all countries, but there is an enormous range. The U.S. stands out with a particularly low proportion, indicating the largest gap between right and left parties.

Of course, the other story here is that both the U.S. and Japan stand out with extremely low percentages of legislators who are women in either party, with Germany doing better but still lagging compared to the proportion of women in the population. On the other hand, both left and right parties in Sweden seem to be capable of recruiting women who run for national office and win.

Birdseed sent in this photo he took at a grocery store in Stockholm (which he posted at his blog as well):

3487134506_c2b6058547_b1

The product is a new beverage, Fanta World Pineapple: Inspired by Jamaica. The two guys in the photo were hired to promote it at the little tiki-style counter. Johan says,

A couple of things leap out at me straight away:

* The continued (post-)colonial association of Jamaica with its plantation produce. The “inspiration” seems limited to the fact that pineapples are grown there for the consumption of the global North. (Canned goods like pineapples still have the charming moniker “kolonialvaror” (colonial merchandise) in Swedish retail jargon.)

* The ridiculous (verging on blackface) stereotypical representation of “Jamaicans” that the kids are suppsed to portray. It seems to have been done with extreme sloppiness – for instance, the Polynesian lava lava (a type of sarong) that they wear has absolutely nothing to do with Jamaica at all, but rather acts to represent an identity-less generalised tropics, dehumanised exotica.

The music was, of course, bad reggae.

I think Johan hits on an important issue here–how often the cultures of non-Westernized countries are mixed together into an undifferentiated image of exoticness–for instance, “tribal” fashion and “traditional” handicrafts often supposedly represent “Africa,” which is a meaningless category given the enormous diversity of cultures, languages, clothing styles, artistic motifs, and so on. But if you put some geometric designs and maybe an elephant on some cloth, it evokes “Africa.”

it’s also interesting that a certain hat shape and dreads have become such easily-identifiable shorthand symbols of Jamaica, and that Fanta is commodifying the idea of Jamaica to sell a product that has no reason to be more “inspired” by Jamaica than anywhere else pineapple is grown–Hawaii, Mexico, Costa Rica, etc. etc. etc.

Gwen Sharp is an associate professor of sociology at Nevada State College. You can follow her on Twitter at @gwensharpnv.

In this 7 1/2 minute video Hans Rosling maps the relationship between life expectancy, GDP, and sexual health and rights over 300 years of Swedish history:

Found at GapMinder.