nation: Sweden

Cross-posted at Montclair SocioBlog.

This graph tracks the share of income going to the top 1% in seven countries.  It’s from a paper by two Swedish economists, Jesper Roine and Daniel Waldenström (pdf).”’

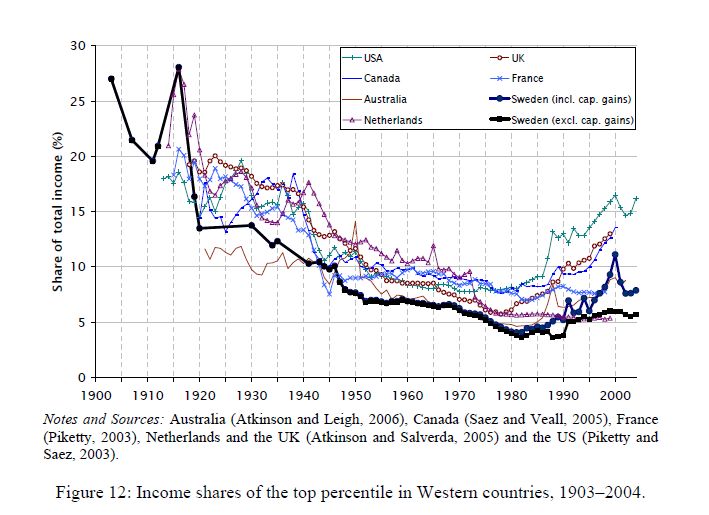
The trend was towards greater equality up to 1980 — the share of the 1% was shrinking.    Since then, the 1% have increased their share of the income pie in all seven countries.  But the graph seems to show important differences, especially in recent decades.  Here is a  cropped version of the graph showing the 1980-2004 years.  I have added straight lines connecting those two points for Sweden and for the U.S.
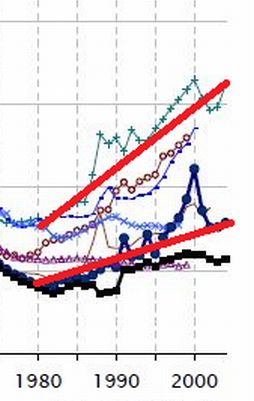
Both changes are increases, but are they the same or are they different?  The answer is crucial.  The U.S. and Sweden have different economic policies.  If the changes are no different between countries, then inequality is just one of those inevitable things that’s happening no matter what governments do.  But if the growth of inequality in the US is much greater than in Sweden, maybe government policy can in fact mitigate the trend towards inequality.
The Swedish 1% share went from a little under 5% to about 7.5%.  In the U.S., the 1% share increased from about 7% to 16%.* You might see those increases as very similar.
In fact, Allan Meltzer in the Wall Street Journal takes precisely that view.  He stretches out the graph to de-emphasize the vertical differences, and adds a title implying that all countries are “together” in this shift of income to the top 1%.
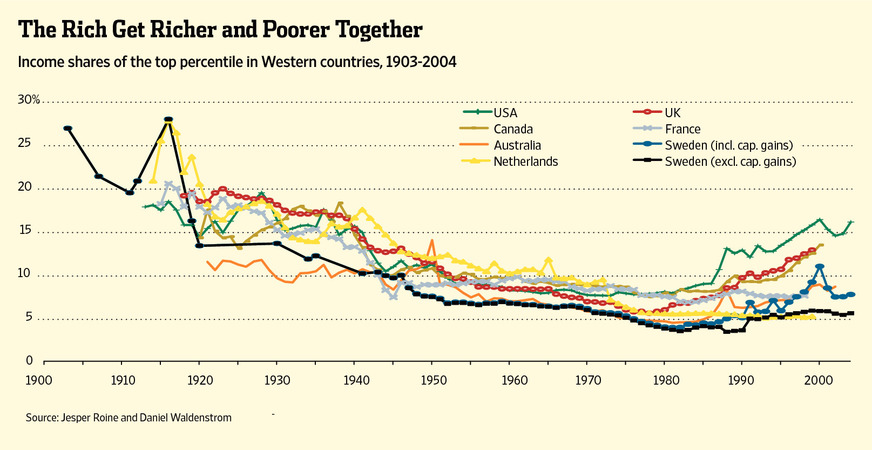
He adds this explanation:
As the . . . chart . . . shows, the share of income for the top 1% in these seven countries generally follows the same trend line. That means domestic policy can’t be the principal reason for the current spread between high earners and others. Since the 1980s, that spread has increased in nearly all seven countries. The U.S. and Sweden, countries with very different systems of redistribution, along with the U.K. and Canada show the largest increase in the share of income for the top 1%. [emphasis added]
If your pay went from $5 an hour to $7.50 an hour while your co-worker’s went from $7 to $16, you might think that your co-worker had gotten a substantially heftier raise.  But if so, that’s because you’re not the Wall Street Journal.
Meltzer’s main point in the article is that we should not raise taxes on the very wealthy.  However, as Bruce Barlett points out (here), if the rich are getting just as rich in high-tax countries like Sweden and the Netherlands as they are in low-tax countries like the U.S., we may as well raise taxes on them. They’ll be doing just as well, like their Swedish and Dutch counterparts, and the nation will have more revenue to put towards Medicare, education, deficit-reduction, etc.But Meltzer is wrong.  Sweden and the Netherlands are very different from the U.S.  As the graph shows, the income share of the 1% in the U.S. is twice that of the 1% in Sweden and 3 times that of the 1% in the Netherlands.  And it has risen more rapidly.  Yet Meltzer claims that inequality trends are similar everywhere.

So who are you going to believe – the Wall Street Journal or your lying eyes?

Cross-posted at Family Inequality.

In 1994, Sara McLanahan and Gary Sandefur published, Growing Up With A Single Parent: What Hurts, What Helps. The growth of children living with only their mothers was — then as now — a matter of concern not only for children’s well-being, but for intergenerational mobility. One of their empirical conclusions was this:

For children living with a single parent and no stepparent, income is the single most important factor in accounting for their lower well-being as compared with children living with both parents. It accounts for as much as half of their disadvantage. Low parental involvement, supervision, and aspirations and greater residential mobility account for the rest.

The biggest problem, in other words, is economic. The other factors —  involvement, supervision, aspirations, mobility — are related to social class and the time poverty that economically-poor parents experience.

Examples

Here are some bivariate illustrations — that is, head-to-head comparisons of the difference between children of poor and non-poor versus single and married parents.

These are the “skill group” rankings by teachers of children by socioeconomic status (or SES, a composite of parents’ education, occupational prestige and income) versus race/ethnicity, gender and family structure. SES shows the widest spread in reading teachers’ group placement of first graders.

Source: Condron (2007)

Similarly, the poor/nonpoor difference is greater than the two-parent/single-parent difference in kindergarten entry scores:

Source: Early Childhood Longitudinal Study (2009)

Those are just two examples from early-childhood assessments. More importantly, here is the breakdown seen in a longitudinal study of children growing up. When women grow up to be mothers, their poverty level in childhood is more important than their family structure for predicting whether they will be in poverty themselves. The poverty difference is large, the family structure difference is not:

Source: Musik & Mare (2006)

This study included a more sophisticated set of multivariate analyses than this simple graph, but the author’s conclusion fits it:

Net of the correlation between poverty and family structure within a generation, the intergenerational transmission of poverty is significantly stronger than the intergenerational transmission of family structure, and neither childhood poverty nor family structure affects the other in adulthood.

That is, childhood poverty matters more.

Fewer single parents, or less poverty?

But if single parenthood and poverty are so closely related, some people say, we should spend hundreds of millions of dollars promoting marriage to help children avoid poverty (and other problems). That’s what the government has done, with money from the welfare budget. Even if it worked, which it apparently doesn’t, it’s only one approach. What about reducing poverty? And, more specifically, reducing the relative likelihood of poverty in single-parent families versus those with married parents. That is, address the poverty gap between the two groups, rather than the size of the two groups. This has the added advantage of not singling out one group — single mothers — for social stigmatization (of the kind I mentioned here). And, because it defines the problem as economic rather than moral, may make it easier to build public support for helping the poor.

Consider a recent paper by David Brady and Rebekah Burroway, which will be published in Demography. They analyzed the relative poverty of single mothers versus the total population — that is, what percentage had incomes below half the median (per person, after accounting for taxes and government transfers). Such a relative poverty measure is really a measure of inequality, but specifically inequality at the low end. (Regardless of how rich the rich are, it’s theoretically possible to have no one below half the median income). Here is my graph showing that result, with only the countries that have reliable sample sizes in the survey:

The Nordic countries have the lowest overall poverty rates. But in absolute terms their advantage is much bigger for single mothers. (The red line shows equal poverty rates for single mothers and the total population.) The US and UK have the largest difference in poverty rates between single mothers and overall poverty. That is, we have the largest poverty penalty for single motherhood. If the relative poverty rates for single mothers were lower in the US, we might spend more time and money addressing poverty and less trying to change family structures.

How does the U.S. compare to other developed countries on measures of social justice? According to the New York Times, not very well.  The visual below compares countries’ poverty rates, poverty prevention measures, income inequality, spending on pre-primary education, and citizen health.  The “overall” rating is on the far left and the U.S. ranks 27th out of 31.


Via Feministing.  See also how the U.S. ranks on measures of equality and prosperity(33 out of 33, for what it’s worth). Thanks to Dolores R. for the link!

Lisa Wade, PhD is an Associate Professor at Tulane University. She is the author of American Hookup, a book about college sexual culture; a textbook about gender; and a forthcoming introductory text: Terrible Magnificent Sociology. You can follow her on Twitter and Instagram.


Katrin let us know about this great clip from PBS News Hour (and posted at Boing Boing) about inequality and Americans’ perceptions about how wealth is distributed in the U.S. It’s a great clip:

PBS posted the pie charts used in the video as well.

Dmitriy T.M. sent in a New York Times slideshow of the contents of “MREs” from different countries.   MREs stands for “Meals Ready to Eat”; they are combat rations for soldiers. The rations are each some combination of comfort food, nutrition, and necessity.  And the different contents across countries reveal some interesting similarities and differences.

All MREs include some sort of meat, but the type and form of the meat vary, from meatballs to paté.  Meanwhile, almost all of the MREs include candy; it’s probably cheap, in the big scheme of things, to throw a few skittles, m&ms, or squares of chocolate, but what a treat it must be.  Likewise, the fruit-flavored beverages and tea must be a taste of home.  As for practicality, countries vary in whether they provide moist towelettes, toothpicks, tooth brushes.   Most offer matches; the U.S. includes toilet paper.

That said, the content of rations are also strikingly consistent.  I’ve love to see a flow chart tracing the development of MREs.  Were the logics for these rations developed in isolation?  Or were some countries influential over others?

These are my uneducated observations.  Feel free to offer more informed thoughts in the comments.

Lisa Wade, PhD is an Associate Professor at Tulane University. She is the author of American Hookup, a book about college sexual culture; a textbook about gender; and a forthcoming introductory text: Terrible Magnificent Sociology. You can follow her on Twitter and Instagram.

Cross-posted at Family Inequality.

I have criticized sloppy statistical work by some international feminist organizations, so I’m glad to have a chance to point out a useful new report and website.

The Progress of the World’s Women is from the United Nations Entity for Gender Equality and the Empowerment of Women. The full-blown site has an executive summary, a long report, and a statistics index page with a download of the complete spreadsheet. I selected a few of the interesting graphics.

Skewed sex ratios (which I’ve written about here and here) are in the news, with the publication of Unnatural Selection, by Mara Hvistendahl. The report shows some of the countries with the most skewed sex ratios, reflecting the practice of parents aborting female fetuses (Vietnam and Taiwan should  be in there, too). With the exception of Korea, they’ve all gotten more skewed since the 1990s, when ultrasounds became more widely available, allowing parents to find out the sex of the fetus early in the pregnancy.

The most egregious inequality between women of the world is probably in maternal mortality. This chart shows, for example, that the chance of a woman dying during pregnancy or birth is about 100- 39-times higher in Africa than Europe. The chart also shows how many of those deaths are from unsafe abortions.

Finally, I made this one myself, showing women as a percentage of parliament in most of the world’s rich countries (the spreadsheet has the whole list). The USA, with 90 women out of 535 members of Congress, comes in at 17%.

The report focuses on law and justice issues, including rape and violence against women, as well as reparations, property rights, and judicial reform. They boil down their conclusions to: “Ten proven approaches to make justice systems work for women“:

1. Support women’s legal organizations

2. Support one-stop shops and specialized services to reduce attrition in the justice chain [that refers to rape cases, for example, not making their way from charge to conviction -pnc]

3. Implement gender-sensitive law reform

4. Use quotas to boost the number of women legislators

5. Put women on the front line of law enforcement

6. Train judges and monitor decisions

7. Increase women’s access to courts and truth commissions in conflict and post-conflict contexts.

8. Implement gender-responsive reparations programmes

9. Invest in women’s access to justice

10. Put gender equality at the heart of the Millennium Development Goals

Does American prosperity translate into long retirements?  Not compared to other developed countries in the world.  Flowing Data borrowed OECD numbers on life expectancy and age of retirement to calculate the average number of years in retirement for men and women across many different countries.  The portion of each bar with the line is the average number of years working, while the non-lined portion represents years in retirement.

Largely because of life expectancy, women enjoy more years than men in all states except Turkey, but the number of years varies quite tremendously, from an average of zero years for men in Mexico, to an average of 26 years for women in Austria and Italy.  The United States is way down on this list, not doing so well relatively after all.

Lisa Wade, PhD is an Associate Professor at Tulane University. She is the author of American Hookup, a book about college sexual culture; a textbook about gender; and a forthcoming introductory text: Terrible Magnificent Sociology. You can follow her on Twitter and Instagram.

Deeb K. sent in a story from the New York Times about who does unpaid work — that is, the housework, carework, and volunteering that people do without financial compensation. Based on time-use surveys by the Organisation for Economic Co-operation and Development (OECD), this chart shows how many more minutes per day women in various nations spend doing such activities compared to men:

Childcare stuck out as an area with a particularly large gap:

On child care in particular, mothers spend more than twice as much time per day as fathers do: 1 hour 40 minutes for mothers, on average, compared to 42 minutes for fathers…On average, working fathers spend only 10 minutes more per day on child care when they are not working, whereas working mothers spend nearly twice as much time (144 minutes vs. 74) when not working.

The full OECD report breaks down types of unpaid work (this is overall, including data for both men and women):

The study also found that non-working fathers spend less time on childcare than working mothers in almost every country in the study (p. 19). And mothers and fathers do different types of childcare, with dads doing more of what we might think of as the “fun stuff” (p. 20):

Source: Miranda, V. 2011. “Cooking, Caring and Volunteering: Unpaid Work around the World.” OECD Social, Employment and Migration Working Papers, No. 116. OECD Publishing.