nation: Sweden

Cross-posted at Montclair SocioBlog.

Back in June, Mitt Romney said:

I want to make sure that we keep America a place of opportunity, where everyone… get[s] as much education as they can afford

After all, Mitt got as much education as he (his parents, really) could afford, so he thought it best if everyone had that same opportunity.

Opportunity – How much is that in American money?

Yesterday, Planet Money  posted this graph showing the costs and benefits of a college education in several countries.

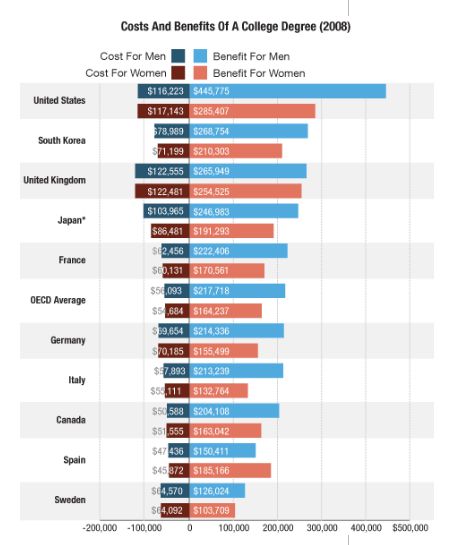
The title of the post summarizes the interpretation of the college-educated folks at Planet Money:

“College Costs More In America, But The Payoff Is Bigger”

But what if you look at the data from the other side?  Here’s the half-empty-glass title:

“College in the US Costs a Lot, and If You Can’t Afford It, You’re Really Screwed”

…or words to that effect.

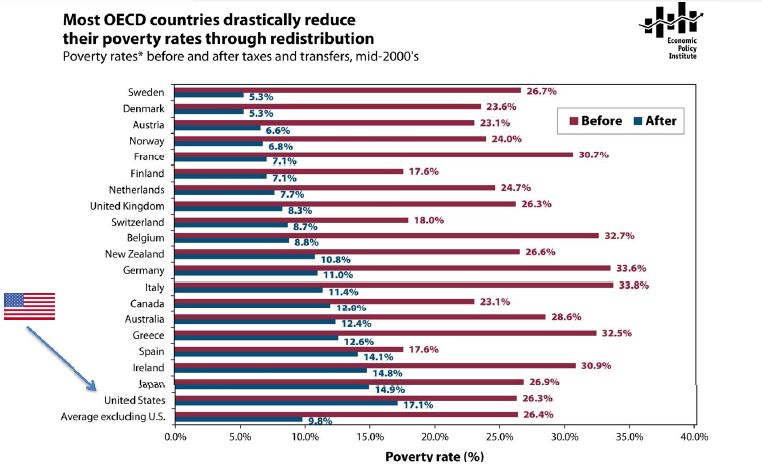
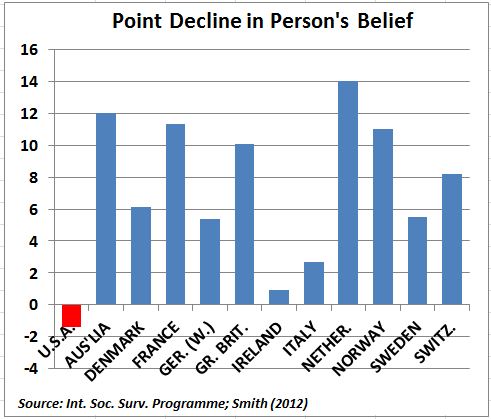
What the chart seems to show is inequality — specifically, the inequality between the college educated and everyone else.  In advanced economies, like the those of the countries in the chart, education is important. But some of those countries, like the Scandinavian countries, have reduced the income sacrificed by non-college people relative to the college educated. Other countries favor a more unequal distribution of income.

To look a little closer, I looked at the relationship between the payoff of a BA degree for men and a country’s Gini coefficient, a measure of inequality.  I used the ten countries in the Planet Money chart and added another ten OECD countries.

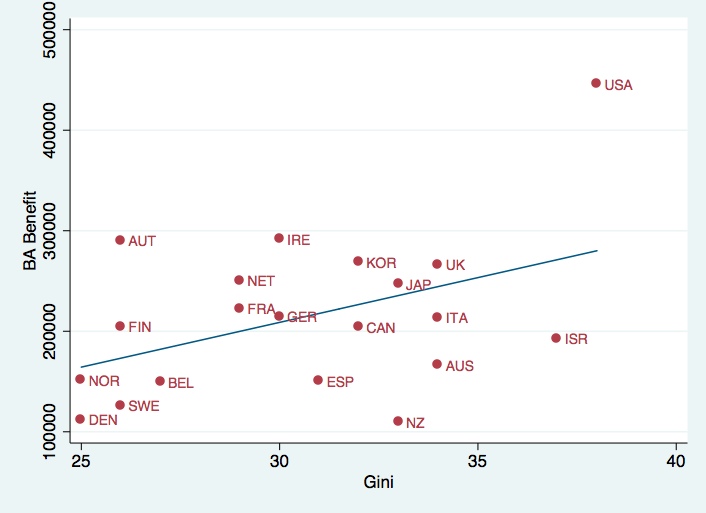
The correlation is 0.44.  The US is the clear outlier.  In the land of opportunity, if you’re a male, either you pay the considerable price of going to college, or you pay the price for not going to college.

With this inequality come the kinds of social consequences that Charles Murray elaborates in his latest book about non-educated Whites — disability, divorce, demoralization, death.

—————————

Jay Livingston is the chair of the Sociology Department at Montclair State University.  You can follow him at Montclair SocioBlog or on Twitter.

Cross-posted at Montclair SocioBlog.

The poverty rate in the US in the mid-2000s was about 17%.  In Sweden, the poverty rate was 5.3%; in Germany, 11%.   That was the rate after adding in government transfers.  In Germany, the poverty rate before those transfers was 33.6%, ten points higher than that in the US.  Sweden’s pre-transfer poverty rate was about the same as ours.

Jared Bernstein has this chart showing pre-transfer and post-transfer rates for the OECD countries (click to enlarge):

Three  points:

1.  Governments have the power to reduce poverty, and reduce it a lot.  European governments do far more towards this goal than does the US government.

2.  It’s unlikely that America’s poor people are twice as lazy or unskilled or dissolute as their European counterparts.  Individual factors may explain differences between individuals, but these explanations have little relevance for the problem of overall poverty.  The focus on individual qualities also has little use as a basis for policy.  European countries have fewer people living in poverty, but not because those countries exhort the poor to lead more virtuous lives and punish them for their improvident ways.  European countries have lower poverty rates because the governments provide money and services to those who need them.

3.  The amount of welfare governments provide does not appear to have a dampening effect on the overall economy.

Cross-posted at Montclair SocioBlog.

As I speculated years ago (here and here), it may be hard for Americans to imagine a world where the law guarantees them at least 20 paid vacation days per year.  But such a world exists.  It’s called Europe.*

Americans are the lucky ones.  As Mitt Romney has warned us “European-style benefits” would   “poison the very spirit of America.”  Niall Ferguson, who weighs in frequently on history and economics, contrasts America’s “Protestant work ethic” with what you find in Europe – an “atheist sloth ethic.”

The graph is a bit misleading. It shows only what the law requires of employers.  Americans do get vacations.  But here in America, how much vacation you get, or whether you get any at all, and whether it’s paid – that all depends on what you can negotiate with your employer.

Since American vacations depend on what the boss will grant, some people get more paid vacation, some get less, and some get none.  So it might be useful to ask which sectors of our economy are beehives of the work ethic and which are sloughs of sloth.  (Ferguson’s employer, for example, Harvard University, probably gives him three months off in the summer, plus a week or two or more in the winter between semesters, plus spring break, and maybe a few other days.  I wonder how he would react if Harvard did away with these sloth-inducing policies.)

The Wall Street Journal recently (here) published a graph of BLS data on access to paid vacations; they break it up by industry near the bottom.

Those people who are cleaning your hotel room and serving your meals while you’re on vacation — only about one in four can get any paid vacation days.  And at the other end, which economic sector is most indulgent of sloth among its workforce?  Wall Street.  Four out of five there get paid vacation.

How much paid vacation do we get?  That depends on sector, but it also depends on length of service.  As the Journal says,

Europeans also get more time off: usually a bare minimum of four weeks off a year. Most Americans have to stay in a job for 20 years to get that much, according to BLS data.

—————————

* The graph is from five years ago, but I doubt things have changed much. The US still has no federal or state laws requiring any paid vacation days.

Cross-posted at Neuroskeptic.

“Personality differences” between people from different countries may just be a reflection of cultural differences in the use of “extreme” language to describe people.

That’s according to a very important paper just out from an international team led by Estonia’s René Mõttus.

There’s a write up of the study here. In a nutshell, they took 3,000 people from 22 places and asked them to rate the personality of 30 fictional people based on brief descriptions (which were the same, but translated into the local language). Ratings were on a 1 to 5 scale.

It turned out that some populations handed out more of the extreme 1 or 5 responses. Hong Kong, South Korea and Germany tended to give middle of the road 2, 3 and 4 ratings, while Poland, Burkina Faso and people from Changchun in China were much more fond of 1s and 5s.

The characters they were rating were the same in all cases, remember.

Crucially, when the participants rated themselves on the same personality traits, they tended to follow the same pattern. Koreans rated themselves to have more moderate personality traits, compared to Burkinabés who described themselves in stronger tones.

Whether this is a cultural difference or a linguistic one is perhaps debatable; it might be a sign that it is not easy to translate English-language personality words into certain languages without changing how ‘strong’ they sound. However, either way, it’s a serious problem for psychologists interested in cross-cultural studies.

I’ve long suspected that something like this might lie behind the very large differences in reported rates of mental illness across countries. Studies have found that about 3 times as many people in the USA report symptoms of mental illness compared to people in Spain, yet the suicide rate is almost the same, which is odd because mental illness is strongly associated with suicide.

One explanation would be that some cultures are more likely to report ‘higher than normal’ levels of distress, anxiety — a bit like how some make more extreme judgements of personality.

So it would be very interesting to check this by comparing the results of this paper to the international mental illness studies. Unfortunately, the countries sampled don’t overlap enough to do this yet (as far as I can see).

Source: Mõttus R, et al (2012). The Effect of Response Style on Self-Reported Conscientiousness Across 20 Countries. Personality and Social Psychology Bulletin PMID: 22745332

————————

Neuroskeptic blogs anonymously here.  You can also follow him on Twitter.

U.S. presidential candidate Mitt Romney recently traveled to Britain, Israel, and Poland, presumably to shore up his foreign policy credentials. Among a number of other statements that got a lot of attention, Romney praised Israel’s health care system, comparing it positively to the U.S. He stressed the cost differences, pointing out that Israel spends significantly less of its GDP on health care. This drew media attention because Israel has universal coverage provided by the state, and the glowing statements seemed a little odd in light of the Republicans’ opposition to the Affordable Care Act and the demonizing of the program as socialism.

But all that aside, how much do Americans spend on health care? Well…a lot. Elizabeth McM. sent us a link to a story at The Atlantic comparing U.S. medical spending to a number of other nations:

What are we spending it on? Hospital care is the single largest expense, followed by the cost of doctor/clinic visits. Another 10% is prescription drugs. The remainder falls into a variety of categories:

With overall spending distributed among so many different sectors of the health care sector, reducing costs requires more than just increased efficiency by hospitals or lowered drug costs — it requires changes and savings throughout the system.

Cross-posted at Reports from the Economic Front.

The Supreme Court has ruled favorably on the legality of the Affordable Care Act.  Actually, despite its name, the Act has more to do with extending and attempting to improve private health insurance coverage than it does with improving care or reducing its cost.

Unfortunately for us, the effort to improve our health care system has remained within bounds set by the needs of private health care providers and insurers.  As President Obama made clear from the start of his push for health care reform, there would be no consideration of a universal system.

Critics of such a universal system are always quick to argue that only market forces driven by the private pursuit of profit can ensure an efficient health care system.  Of course, in determining whether this is true, we need to recognize that efficiency is a complex term and that our health care system, like all systems, produces multiple outcomes.  The most obvious ones are private profit as well as the quality and cost of the relevant health care.

In terms of private profit there can be no doubt that our health care system functions well.  However, the story is quite different if we evaluate it in terms of quality and cost.  The fact that we continue to embrace a private health care system makes clear which measures of efficiency are considered most important and by whom.

The following map shows the countries, colored green, that have adopted a universal health care system.

mf-healthcaremap-p-thumb-615x314-91612.jpg

As Max Fisher explains:

What’s astonishing is how cleanly the green and grey separate the developed nations from the developing, almost categorically. Nearly the entire developed world is colored, from Europe to the Asian powerhouses to South America’s southern cone to the Anglophone states of Australia, New Zealand, and Canada. The only developed outliers are a few still-troubled Balkan states, the Soviet-style autocracy of Belarus, and the U.S. of A., the richest nation in the world.

The handful of developing countries that provide universal access to health care include oil-rich Saudi Arabia and Oman, Latin success story Costa Rica, Kyrgyzstan, and, famously, Cuba, among a few others. A number of countries have attempted universal health care but failed, such as South Africa, which maintains a notoriously inefficient and troubled public plan to complement the private plans popular among middle- and upper-class citizens…

That brings us to another way that America is a big outlier on health care. The grey countries on this map tend to spend significantly less per capita on health care than do the green countries — except for the U.S., where the government spends way more on health care per person than do most countries with free, universal health care. This is also true of health care costs as a share of national GDP — in other words, how much of a country’s money goes into health care.

The OECD just published a major study on the health care systems of its 34 member nations.  It found that:

 Health spending accounted for 17.6% of GDP in the United States in 2010, down slightly from 2009 (17.7%) and by far the highest share in the OECD, and a full eight percentage points higher than the OECD average of 9.5%. Following the United States were the Netherlands (at 12.0% of GDP), and France and Germany (both at 11.6% of GDP).

The United States spent 8,233 USD on health per capita in 2010, two-and-a-half times more than the OECD average of 3,268 USD (adjusted for purchasing power parity). Following the United States were Norway and Switzerland which spent over 5,250 USD per capita. Americans spent more than twice as much as relatively rich European countries such as France, Sweden and the United Kingdom.

combined1.jpg
What does all of this mean in terms of health outcomes?  According to the OECD report:

Most OECD countries have enjoyed large gains in life expectancy over the past decades. In the United States, life expectancy at birth increased by almost 9 years between 1960 and 2010, but this is less than the increase of over 15 years in Japan and over 11 years on average in OECD countries. As a result, while life expectancy in the United States used to be 1½ year above the OECD average in 1960, it is now, at 78.7 years in 2010, more than one year below the average of 79.8 years. Japan, Switzerland, Italy and Spain are the OECD countries with the highest life expectancy, exceeding 82 years.

One possible explanation for this lagging performance, highlighted in an earlier OECD report, is that the U.S. ranked 26th in terms of the number of practicing physicians relative to its population, 29th in terms of the number of doctor consultations per capita, 29th in terms of the number of hospital beds per capita, and 29th in terms of the average length of hospital stay.  At the same time, the “U.S. health system does do a lot of interventions… it has a lot of expensive diagnostic equipment, which it uses a lot. And it does a lot of elective surgery — the sort of activities where it is not always clear cut about whether a particular intervention is necessary or not.”

Private health care providers and insurers are clear about how they measure health care efficiency.  And as long as we rely on them to set the terms of the debate we will continue to suffer the consequences.

In a previous post I discussed how the U.S. became more religious in the 1950s, in part in response to its the Cold War enemies (atheist communists).  In fact, the U.S. is among the most religious countries in the world.  Using data from the International Social Survey Programme, Sociologist Tom Smith paints wildly different religious portraits of 28 nations (full text).

When asked whether they “know that God really exists and… have no doubt about it,” 61% of Americans say “yes.”  Of the 28 nations studied, only four were more likely to say “yes” to this question: Poland, Israel, Chile, and the Philippines. Here’s how we look compared to similar countries:

Here’s all 28 in rank order (borrowed from LiveScience).  Notice how wide the divergence is.  In Japan, the least religious country according to this measure, only 4% say they have no doubt God exists.  In The Philippines, 84% have no doubt.

% Have No Doubt God Exists:

  • Japan: 4.3 percent
  • East Germany: 7.8 percent
  • Sweden: 10.2
  • Czech Republic: 11.1
  • Denmark: 13.0
  • Norway: 14.8
  • France: 15.5
  • Great Britain: 16.8
  • The Netherlands: 21.2
  • Austria: 21.4
  • Latvia: 21.7
  • Hungary: 23.5
  • Slovenia: 23.6
  • Australia: 24.9
  • Switzerland: 25.0
  • New Zealand: 26.4
  • West Germany: 26.7
  • Russia: 30.5
  • Spain: 38.4
  • Slovakia: 39.2
  • Italy: 41.0
  • Ireland: 43.2
  • Northern Ireland: 45.6
  • Portugal: 50.9
  • Cyprus: 59.0
  • United States: 60.6
  • Poland: 62.0
  • Israel: 65.5
  • Chile: 79.4
  • The Philippines: 83.6

Americans are also particularly likely to believe in a “personal God,” one who is closely attentive to the lives of each and every person.

Quite interestingly, the U.S. is in the minority in that Americans tend to become increasingly religious as they age.  In most countries, people become less religious over time.  This graph (confusingly labeled), shows changes in DISbelief over the life course.  The U.S. is the only country among these in which disbelief declines:

Lifetime Change in Religiosity (from increase in disbelief to increase in belief):

  • The Netherlands: -14.0
  • Spain: -12.4
  • Australia: -12.0
  • France: -11.3
  • Norway: -11.0
  • Great Britain: -10.1
  • Switzerland: -8.2
  • Germany (East): -6.9
  • Denmark: -6.1
  • Czech Republic: -5.5
  • Sweden: -5.5
  • Germany (West): -5.4
  • New Zealand: -4.0
  • Italy: -2.7
  • Poland: -1.8
  • Japan: -1.5
  • Ireland: -0.9
  • Chile: +0.1
  • Cyprus: +0.2
  • Portugal: +0.6
  • The Philippines: +0.8
  • Hungary: +1.0
  • Northern Ireland: +1.0
  • United States: +1.4
  • Israel: +2.6
  • Slovakia: +5.6
  • Slovenia: +8.5
  • Latvia: +11.9
  • Russia: +16.0

Rates of atheism — a strong disbelief in God — also vary tremendously.  East Germany is the most atheist, with more than half of citizens claiming disbelief.  The country is a stark contrast to the atheist among them, Poland and the U.S. (only 3% atheist), Chile and Cyprus (2%), and The Phillipines (1%).

% Atheist:

  • East Germany: 52.1
  • Czech Republic: 39.9
  • France: 23.3
  • The Netherlands: 19.7
  • Sweden: 19.3
  • Latvia: 18.3
  • Great Britain: 18.0
  • Denmark: 17.9
  • Norway: 17.4
  • Australia: 15.9
  • Hungary: 15.2
  • Slovenia: 13.2
  • New Zealand: 12.6
  • Slovakia: 11.7
  • West Germany: 10.3
  • Spain: 9.7
  • Switzerland: 9.3
  • Austria: 9.2
  • Japan: 8.7
  • Russia: 6.8
  • Northern Ireland: 6.6
  • Israel: 6.0
  • Italy: 5.9
  • Portugal: 5.1
  • Ireland: 5.0
  • Poland: 3.3
  • United States: 3.0
  • Chile: 1.9
  • Cyprus: 1.9
  • The Philippines: 0.7

As a post-9/11 American watching another election cycle, I can’t help but notice how so much of our rhetoric revolves — sometimes overtly and sometimes not — around people who are the wrong religion.  Notably, Muslims.  And yet, the U.S. and many Muslim countries are alike in being strongly religious, at least in comparison to the many strongly secular countries.

This is odd because stands in contrast to recent data on American attitudes.  Within the U.S., people express much less tolerance for atheists than they do Muslims (homosexuals, African Americans, and immigrants). Weirdly, we think we have more in common with more secular nations like Great Britain than we do with countries like Pakistan or Saudi Arabia. In certain ways, the opposite might be true.

Thanks to Claude Fischer for the graphs.  Fischer, a sociologist at UC Berkeley, is the author of Made in America: A Social History of American Culture and Character.

Lisa Wade, PhD is an Associate Professor at Tulane University. She is the author of American Hookup, a book about college sexual culture; a textbook about gender; and a forthcoming introductory text: Terrible Magnificent Sociology. You can follow her on Twitter and Instagram.

April 15th was World Art Day.  A museum in Stockholm, the Moderna Museet, celebrated with what appears to be a chocolate and red velvet cake in the likeness of a caricature of member of a generic African tribe.  The cake was designed by an artist, Makode Aj Linde, who wanted to draw attention to the practice of female genital cutting, which occurs in parts of Africa (and elsewhere).  Accordingly, the cake was in the shape of a woman’s shoulders, breasts, belly, and genitals; it was covered in black fondant.  The head was the artist himself, painted black with cartoon-ish eyes and mouth reminiscent of American minstrelsy. Neck coils tied it all together.

The Swedish minister of culture, Adelsohn Liljeroth, was asked to cut the cake.  Playing along with the “art,” she began at the clitoris.  After slicing herself a piece, she fed it to the artist (it’s unclear if that was planned or improvised).  Each reveler carved out more and more of the genitals, revealing brown and then red cake inside.  With each cut, the artist let out a yell and cried.  People attending the exhibit reportedly gawked and generally went along having a good time.

Kitimbwa Sabuni, a spokesperson for the National Afro-Swedish Association, called the cake a “racist caricature of a black woman” and criticized the event, writing:

The “participation [of the minister of culture], as she laughs, drinks, and eats cake, merely adds to the insult against people who suffer from racist taunts and against women affected by circumcision.”

The minister shrugged rhetorically, saying  “Art needs to be provocative.”  On his Facebook page, the artist was nonchalant, writing about the above photo: “This is After getting my vagaga mutilated by the minister of culture…”

I will go on the record saying that this is obviously racist, trivializes genital cutting, is wildly insensitive to women who have experienced cutting, and fails to accord any respect to members of communities that practice genital cutting.  It’s a shameful mockery.

————————

UPDATE: It occurred to me that it’s possible that the artist intended to trap a mostly white audience into participating in this obviously racist game, all with the intention of revealing that they would.  Sort of like Spike Lee’s Bamboozled, where the fictional African American tv writer, asked by his White boss to write something “Black,” wrote the most racist thing he could think of… only to discover that audiences loved it.  So perhaps the artist meant to provoke the same sort of horror that Bamboozled provokes in its real audience.  And that is provocative indeed.  But I’m guessing that this message will be lost on the vast majority of people at the same time it provides a satisfying opportunity to object to something obviously racist (as I did); meanwhile, more subtle discrimination and institutionalized racism remains un-examined.

————————

One of my main areas of serious academic research involves trying to understand how Westerners think about female genital cutting, and what motivates them to understand it in the way they do.  I must say, though, that I am at a loss to explain this.  My research on American perceptions of the practice (not Swedish, notably) suggests that we take the practice extremely seriously, framing it as (one of) the worst human rights abuses imaginable.  From this perspective, this approach to raising awareness — from the party-atmosphere symbolized by the cake to the almost comical and obviously fake protestations from the artist/actor — takes the issue far too frivolously for comfort.

Caricaturing Africans, however, and seeing them as lesser humans is also part of what drives American condemnation of genital cutting.  U.S. discourses often frame Africans as either ignorant or cruel.  We routinely dehumanize both women and men in these discourses.  They are seen more as objects of intervention than human beings.  Accordingly, it doesn’t surprise me too much that the (mostly White, Swedish) people viewing the performance felt enough distance from the practice of genital cutting to enjoy their cake.  Nor does it surprise me to hear at least some of them dismiss the concerns of the spokesperson for the National Afro-Swedish Association.

The video, in all its glory:

Thanks to Sharla F., Samira A., and an anonymous reader for sending in the tip to this story!

Lisa Wade, PhD is an Associate Professor at Tulane University. She is the author of American Hookup, a book about college sexual culture; a textbook about gender; and a forthcoming introductory text: Terrible Magnificent Sociology. You can follow her on Twitter and Instagram.