marriage/family

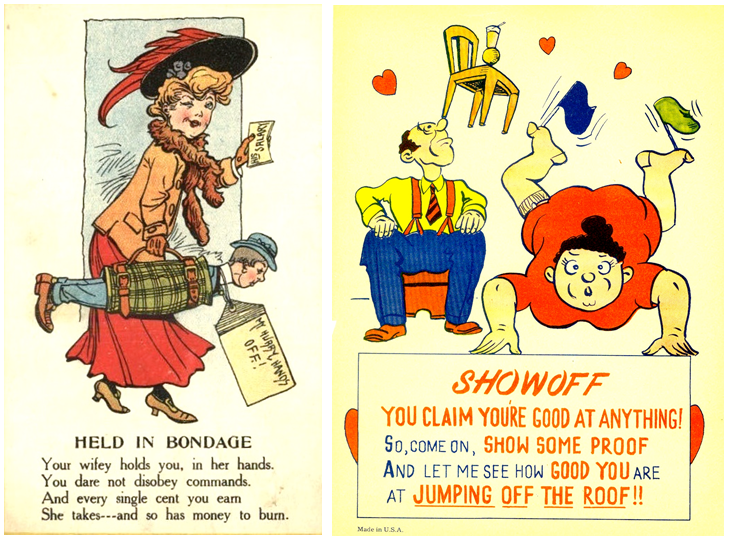
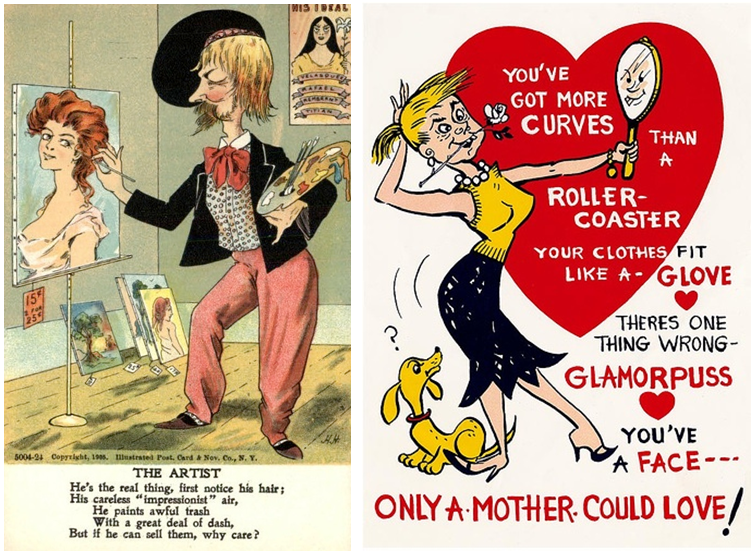
CollegeHumor posted a set of fake Puritan-themed Valentine’s Day cards.  They’re a humorous way of reminding us that our intensive focus on romantic love as a driving force for sex and marriage is, in fact, quite new.

1

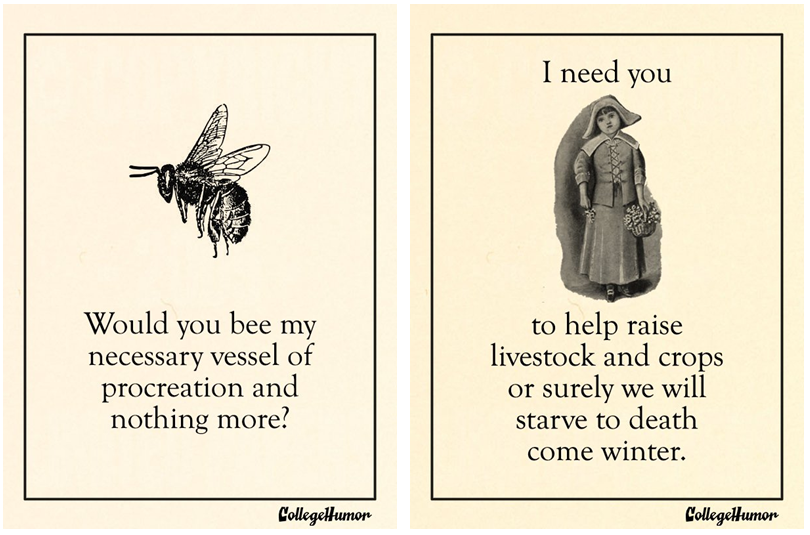
When the Puritans landed on the rocky east coast of America in the 1600s, they brought with them the belief that sex should be restricted to intercourse in marriage, hence the sentiment on the left. All non-marital and non-reproductive sexual activities were forbidden, including pre- and extra-marital sex, homosexual sex, masturbation, and oral or anal sex (even if married).   Violations of the rules were punished by fines, whipping, public shaming (yes, with “scarlet letters”), ostracism, or even death.

Alongside religion, there were practical reasons why the Puritans were so darn puritanical.  Colonizing the U.S. was a dangerous job; lots of people were dying from exposure, starvation, illness, and war.  Babies replenished the labor supply, motivating the Puritans to channel the sex drive towards the one sexual activity that made babies: intercourse. Accordingly, having intercourse with your spouse wasn’t only allowed, it was essential; women could divorce men who had proven impotent.  

The Puritans also married primarily to form practical partnerships for bearing children and mutual survival, hence the sentiment in the card on the right.

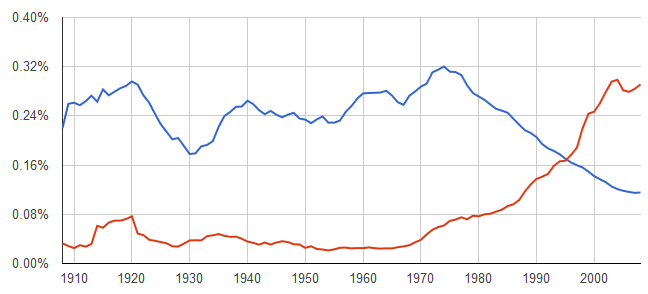
The idea that love should be the basis for marriage didn’t take hold until the Victorian era, when industrialization was changing the value of children.  Useful on the farm, children were suddenly became a burden in expensive and overcrowded lodgings.  This gave couples a new reason to limit the number of children they had and, because industrial production had made condoms increasingly cheap and effective, they could.  Marital fertility rates dropped precipitously between 1800 and 1900: from 6+ children/woman to 3 1/2 in the U.S., England, and Wales.

In this context, a Puritan sexual ethic that restricted sex to efforts to make babies just didn’t make sense. People needed a new logic to guide sexual activity: the answer was love. Over the course of the 1800s, Victorians slowly abandoned the Puritan idea that sex was only for reproduction, embracing instead the now familiar idea that sex could be an expression of love and a source of pleasure, an idea that still resonates strongly today.

That’s at least part of the story anyway.

Sources:

Bremer, Francis J., and Tom Webster.  2006. Puritans and Puritanism in Europe and America: A Comprehensive Encyclopedia. SantaBarbara: ABC-CLIO, Inc.

D’Emilio, John & Estelle Freedman. 1997. Intimate Matters: A History of Sexuality in America. Chicago: University of Chicago Press.

Freedman, Estelle. 1982. Sexuality in Nineteenth Century America: Behavior, Ideology, and Politics. Reviews in American History 10, 4: 196-215.

Lisa Wade, PhD is an Associate Professor at Tulane University. She is the author of American Hookup, a book about college sexual culture; a textbook about gender; and a forthcoming introductory text: Terrible Magnificent Sociology. You can follow her on Twitter and Instagram.

For 100 years Valentine’s Day was not only associated with sweet sentiments, but was an occasion to send a cruel and biting message to someone you didn’t like.  These cards — called “vinegar valentines” — were popular from 1840 to 1940 in both America and the U.K.

1Annebella Pollen, an art and design historian who talks about the valentine’s at Collector’s Weekly, explains that there was a valentine for many types of people and occasions:

 You could send them to your neighbors, friends, or enemies. You could send them to your schoolteacher, your boss, or people whose advances you wanted to dismiss. You could send them to people you thought were too ugly or fat, who drank too much, or people acting above their station. There was a card for pretty much every social ailment.

23

Pollen insists that people did send them to one another, albeit anonymously, and they were not meant to be jokes. Instead, they were meant to say: “Your behavior is unacceptable.”  For much of the 1800s there was no such thing as a pre-paid stamp, so the person who got the mail paid for it, so often they were forced to buy their own insults, a twist of the knife from the sender.

4

Many, many more vinegar valentine’s at Collector’s Weekly, where I also stole this great title.  Via BoingBoing.

Lisa Wade, PhD is an Associate Professor at Tulane University. She is the author of American Hookup, a book about college sexual culture; a textbook about gender; and a forthcoming introductory text: Terrible Magnificent Sociology. You can follow her on Twitter and Instagram.

Last month the New York Post ran with this unflattering cover photo of Hillary Clinton responding strongly to congressional questioning and the tagline “No Wonder Bill’s Afraid.”

The not-so-subtle sexist messages include:

  • Even if you’re secretary of state in the most powerful country in the world, it’s not alright to get angry if you’re a woman;
  • when a powerful woman raises her voice to make a point, she is out of control — “exploding with rage”;
  • and when a man is married to a powerful woman, even a man who used to lead the free world, he is automatically cowed by her.

Despite rapid gains in women’s political and corporate leadership since the 1970s, powerful women are still held to the damaging double-bind of appearing “properly” masculine in order to appear
leaderly and “properly” feminine so as to not violate social expectations.

Caroline Heldman is a professor of politics at Occidental College. You can follow her at her blog and on Twitter and Facebook.

Cross-posted at Family Inequality.

It’s not that “working families” don’t exist, it’s just the way most people use this term it doesn’t mean anything.  Search Google images for “working families,” and you’ll find images like this:

And that’s pretty much the way the term is used: every family is a working family.

To hear the White House talk, you have to wonder whether there are people who aren’t in families. I’ve complained about this before, Obama’s tendency to say things like, “This reform is good for families; it’s good for businesses; it’s good for the entire economy.” As if “families” covers all people.

Specifically, if you Google search the White House website’s press office directory, which is where the speeches live, like this, you get 457 results, such as this transcript of remarks by Michelle Obama at a “Corporate Voices for Working Families” event. The equivalent search for “working people” yields a paltry 108 hits (many of them Obama speeches at campaign events, which include false-positives, like him making the ridiculous claim that Americans are the “hardest working people on Earth.”) If you search the entire Googleverse for “working families” you get about 318 million hits, versus just just 7 million for “working people” (less than the 10 million that turns up for “Kardashians,” whatever that means.)

You would never know that 33 million Americans live alone — comprising 27% of all households. And 50 million people, or one out of every 6 people, lives in what the Census Bureau defines as a “non-family household,” or a household in which the householder has no relatives (some of those people may be cohabitors, however). The rise of this phenomenon was ably described by Eric Klinenberg in Going Solo: The Extraordinary Rise and Surprising Appeal of Living Alone.

This is partly a complaint about cheap rhetoric, but it’s also about the assumption that families are primary social units when it comes to things like policy and economics, and about the false universality of “middle class” (which is made up of “working families”) in reference to anyone (in a family with anyone) with a job.

Here’s one visualization, from a Google ngrams search of millions of books. The blue line is use of the phrase “working people” as a fraction of references to “people,” while the red line is use of the phrase “working families” as a fraction of references to “families.” It shows, I think, that “working” is coming to define families, not people.

This isn’t all bad. Families matter, and part of the attention to “working families” (or Families That Work) is driven by important problems of work-family conflict, unequal care work burdens, and so on. But ultimately these are problems because they affect people (some of whom are in families). When we treat families as the primary unit of analysis, we mask the divisions within families — the conflicts of interest and exploitation, the violence and abuse, and the ephemeral nature of many family relationships and commitments — and we contribute to the marginalization of people who aren’t in, or don’t have, families.  And those members of the No Family community need our attention, too.

Philip N. Cohen is a professor of sociology at the University of Maryland, College Park, and writes the blog Family Inequality. You can follow him on Twitter or Facebook.

Cross-posted at The Huffington Post.

Last month Jet — a magazine marketed to African-American population — featured their first gay male couple in their wedding announcements.  The announcement may be a sign that African-American attitudes towards gay marriage may be turning around.  While the group has typically endorsed gay marriage at lower rates than White Americans, the gap between Blacks and Whites has been narrowing.

The Pew Research Center reports that the percent of Whites opposed to gay marriage dropped from 51% in 2008 to 41% in 2012.  Among Blacks, the percent in opposition dropped from 63% to 49%.  African-Americans and Whites are now separated by eight percentage points instead of twelve.

The data above was collected in April of 2012.  In May, Obama announced that he supported gay marriage.  It remains to be seen whether Obama’s modeling of a pro-gay stance will influence the opinions of the African-American community further.

Lisa Wade, PhD is an Associate Professor at Tulane University. She is the author of American Hookup, a book about college sexual culture; a textbook about gender; and a forthcoming introductory text: Terrible Magnificent Sociology. You can follow her on Twitter and Instagram.

Cross-posted at Family Unequal.

As I wrote about the older-birth-mothers issue recently (first, and then), I didn’t comment on the photo illustrations people are using with the stories. But when an alert reader sent this one to me, from Katie Roiphe’s post in Slate, I couldn’t help it:

Something about that picture and “women in their late 30s or 40s” rubbed my correspondent the wrong way, or rather, led her to write, “Late 30s or early 40s?!?”

Since this was from a legit website that credits its stock agency, I was able to visit Thinkstock and search for the photo. Sure enough:

Of course, it’s not news, so the title “Middle-aged woman holding her newborn grandson” doesn’t make it a less true illustration of the older-mother phenomenon than one captioned “Desperate aging woman clings to feminist myth that it’s OK to delay childbearing.” But it gives you an idea of what the Slate editor was looking for in the stock photo.

I looked around a little, and found one other funny one. Another Slate essay,this one by Allison Benedikt, was reprinted in Canada’s National Post, and they laid it out like this:

When I visited the Getty Images site, I discovered this picture was taken in China. Here’s how it’s presented:

This one, which is a picture of real people, looks like it could be a grandmother, or maybe more likely a caretaker. Regardless, it’s sold as an illustration of a story about China’s elderly having too few grandchildren to take care of them, which is vaguely related to the content of the story, but that’s not what the Post’s caption points to:

It’s true that older parents are more established and experienced but many of those experiences are, from a genetic point of view, negative, says Allison Benedikt.

Anyway, there were others where the women looked pretty old for the story, but I couldn’t find them in the catalogs, so I stopped.

This is all relevant to one of my critiques of these stories, which is that they make it seem like having children at older ages has become more common than it was in the past. That’s true compared with 1980, but not 1960. The difference is it’s more likely to be their first child nowadays. So Benedikt is way off when she writes,

Remember how there was that one kid in your high school class whose parents were sooooo old that it was weird and creepy? That’s all of us now. Oops.

As I showed, 40-year-old women are less likely to have children now than they were when she was a kid. And when Roiphe writes of the “50-year-old mother in the kindergarten class [who] attracts a certain amount of catty interest and disapproval,” she should be aware that the disapproval — which I don’t doubt exists — is not about the increased frequency of older mothers, but about how people think about them.

Philip N. Cohen is a professor of sociology at the University of Maryland, College Park, and writes the blog Family Inequality. You can follow him on Twitter or Facebook.

Cross-posted at Family Inequality and The Atlantic.

The problem of income inequality often gets forgotten in conversations about biological clocks.

The dilemma that couples face as they consider having children at older ages is worth dwelling on, and I wouldn’t take that away from Judith Shulevitz’s essay in the New Republic, “How Older Parenthood Will Upend American Society,” which has sparked commentary from Katie RoipheHanna RosinRoss Douthat, and Parade, among many others.

The story is an old one — about the health risks of older parenting and the implications of falling fertility rates for an aging population — even though some of the facts are new. But two points need more attention. First, the overall consequences of the trend toward older parenting are on balance positive, both for women’s equality and for children’s health. And second, social-class inequality is a pressing — and growing — problem in children’s health, and one that is too easily lost in the biological-clock debate.

Older mothers

First, we need to distinguish between the average age of birth parents on the one hand versus the number born at advanced parental ages on the other. As Shulevitz notes, the average age of a first-time mother in the U.S. is now 25. Health-wise, assuming she births the rest of her (small) brood before about age 35, that’s perfect.

Consider two measures of child well-being according to their mothers’ age at birth. First, infant mortality:

(Source: Centers for Disease Control)

Health prospects for children improve as women (and their partners) increase their education and incomes, and improve their health behaviors, into their 30s. Beyond that, the health risks start accumulating, weighing against the socioeconomic factors, and the danger increases.

Second, here is the rate of cognitive disability among children according to the age of their mothers at birth, showing a very similar pattern:

(Source: Calculations made for my working paper)

Again, the lowest risks are to those born when their parents are in their early 30s, a pattern that holds when I control for education, income, race/ethnicity, gender, and child’s age.

When mothers older than age 40 give birth, which accounted for 3 percent of births in 2011, the risks clearly are increased, and Shulevitz’s story is highly relevant. But, at least in terms of mortality and cognitive disability, an average parental age in the late 20s and early 30s is not only not a problem, it’s ideal.

Unequal health

But the second figure above hints at another problem — inequality in the health of parents and children. On that purple chart, a college graduate in her early 40s has the same risk as a non-graduate in her late 20s. And the social-class gap increases with age. Why is the rate of cognitive disabilities so much higher for the children of older mothers who did not finish college? It’s not because of their biological clocks or genetic mutations, but because of the health of the women giving birth.

For healthy, wealthy older women, the issue of aging eggs and genetic mutations from fathers’ run-down sperm factories are more pressing than it is for the majority of parents, who have not graduated college.

If you look at the distribution of women having babies by age and education, it’s clear that the older-parent phenomenon is disproportionately about more-educated women. (I calculated these from the American Community Survey, because age-by-education is not available in the CDC numbers, so they are a little different.)

Most of the less-educated mothers are giving birth in their 20s, and a bigger share of the high-age births are to women who’ve graduated college — most of them married and financially better off. But women without college degrees still make up more than half of those having babies after age 35, and the risks their children face have more to do with high blood pressure, obesity, diabetes, and other health conditions than with genetic or epigenetic mutations. Preterm births, low birth-weight, and birth complications are major causes of developmental disabilities, and they occur most often among mothers with their own health problems.

Most distressing, the effects of educational (and income) inequality on children’s health have been increasing. Here are the relative odds of infant mortality by maternal education, from 1986 to 2001, from a study in Pediatrics. (This compares the odds to college graduates within each year, so anything over 1.0 means the group has a higher risk than college graduates.)

This inequality is absent from Shulevitz’s essay and most of the commentary about it. She writes, of the social pressure mothers like her feel as they age, “Once again, technology has given us the chance to lead our lives in the proper sequence: education, then work, then financial stability, then children” — with no consideration of the 66 percent of people who have reached their early 30s with less than a four-year college degree. For the vast majority of that group, the sequence Shulevitz describes is not relevant.

In fact, if Shulevitz had considered economic inequality, she might not have been quite as worried about advancing parental age. When she worries that a 35-year-old mother has a life expectancy of just 46 more years — years to be a mother to her child — the table she consulted applies to the whole population. She should breathe a little bit easier: Among 40-year-old white college graduates women are expected to live an average extra five years compared with those who have a high school education only.

When it comes to parents’ age versus social class, the challenges are not either/or. We should be concerned about both. But addressing the health problems of parents — especially mothers — with less than a college degree and below-average incomes is the more pressing issue — both for potential lives saved or improved and for social equality.

Philip N. Cohen is a professor of sociology at the University of Maryland, College Park, and writes the blog Family Inequality. You can follow him on Twitter or Facebook.

Cross-posted at Reports from the Economic Front.

One of the subthemes of current discussions about how best to reduce our national debt is that we must rein in out-of-control spending on federal safety net programs.   The reality is quite different.

The chart below shows spending trends in terms of GDP for the ten major needs-tested benefit programs that make-up our federal social safety net. The programs, in the order listed on the chart, are:

  • The refundable portion of the health insurance tax credit enacted in the 2010 health care reform law
  • Medicaid and the Children’s Health Insurance Program (CHIP)
  • The Supplemental Nutrition Assistance Program (SNAP)
  • Financial assistance for post-secondary students (Pell Grants)
  • Compensatory Education Grants to school districts
  • Assisted Housing
  • The Earned Income Tax Credit (EITC)
  • The Additional Child Tax Credit (ACTC)
  • Supplemental Security Income (SSI)
  • Family Support Payments

lowincprogs

As Jared Bernstein explains:

…for all the popular wisdom that programs to help low-income people are swallowing the economy, the truth is that like so much else that plagues our fiscal future, it’s all about health care spending.  The figure shows that as a share of GDP, prior to the Great Recession, non-health care spending was cruising along at around 1.5% for decades.  It was Medicaid/CHIP (Medicaid expansion for kids) that did most of the growing.

The takeaway from this: we need a new health care system (think single payer).

Regardless, the recent explosion in the ratio of Medicare/CHIP spending to GDP is largely due to the severity of the Great Recession, not the generosity of the programs. The recession increased poverty and thus eligibility for the programs, thereby pushing up the numerator, while simultaneously lowering GDP, the denominator.   Moreover, spending on all non-health care safety net programs is on course to dramatically decline as a share of GDP. Even Medicare/Chip spending is projected to stabilize as a share of GDP.

These programs are essential given the poor performance of the economy, and in most cases poorly-funded. Cutting their budgets will not only deny people access to health care, housing, education, and food, it will also further weaken the economy, in both the short and long run.

—————————

Martin Hart-Landsberg is a professor of Economics and Director of the Political Economy Program at Lewis and Clark College.  You can follow him at Reports from the Economic Front.