science/technology: internet

Sociologist Joel Best debunks the idea that “sex bracelets” — bracelets that indicate what type of sex you’re interested in and that oblige you to perform it — are really a thing. He and his colleague, Katherine Bogle, have been tracing the story over time on the internet and across continents in what he calls “the dynamics of rumor and legend.”

Lisa Wade, PhD is an Associate Professor at Tulane University. She is the author of American Hookup, a book about college sexual culture; a textbook about gender; and a forthcoming introductory text: Terrible Magnificent Sociology. You can follow her on Twitter and Instagram.

In this 21-minute talk, Bruce Schneier does a great job of explaining the difference between feeling secure and being secure.  The difference between risk and the perception of risk is one of the things that sociologists in the “social problems” sub-area study.  Whether problems are seen as problems at all, whether non-problems are believed to be problems, and whether they are seen as social (versus individual, for example, or natural)… all of these things must be established by people who have the power to put issues on the agenda and frame them in particular ways.

Schneier’s discussion of security is a great illustration of this phenomenon, and his talk is full of concrete examples and psychological mechanisms that nicely balance the sociological import:

Lisa Wade, PhD is an Associate Professor at Tulane University. She is the author of American Hookup, a book about college sexual culture; a textbook about gender; and a forthcoming introductory text: Terrible Magnificent Sociology. You can follow her on Twitter and Instagram.

A QR, or Quick Response, code on a bulletin board of a college campus:

Steve Grimes shared this image and some interesting thoughts about how Quick Response codes, or QR codes, can contribute to inequality. That is, QR codes such as these serve to make certain content and information “exclusive” to those who have smartphones. He states,

There is a general thinking that technology can create a level playing field (an example of this is can be seen with the popular feelings about the internet). However, technology also has a great ability to create and widen gaps of inequality.

In a practical sense the company may be looking for students who are tech savvy. Using the matrix barcode may serve that purpose. However, the ad also shows how technology can exclude individuals; primarily in this case, students without smart phones. Ironically it is especially the students who need work (“need a job”) who may not have the money to afford a smart phone to read the ad.

Grimes’ thoughts are judicious, and reveal the inherent structural difficulties in alleviating inequality.  QR codes are one form of “digital exclusivity,” the tendency of technology to re-entrench (mostly) class disparities in access to information. Though they may be able to access the information later when they have access to a computer, the person who has the smartphone is certainly living in a much more augmented world than the person without.

If we take as our assumption that access to information is a form of capital, than we can easily see how such technologies are implicated in the field of power. We can also see how digital exclusivity can contribute to the larger digital divide. In this sense, digital exclusivity, as a characteristic of particular technologies and forums (in this case as an access-point to particular forms of knowledge and information), contributes to larger inequalities of power and access to information in the digital age.

QR codes, though, may not be the best example of a digitally-exclusive technology. That is, QR codes have yet to serve as a common conduit of important information—access to such information has similarly meant little in terms of social or economic capital. It turns out that even most people with smartphones don’t know what they are or aren’t interested in using them. Grimes’ understandable frustration the digital divide, combined with the uneven usage of QR codes among mobile phone-using countries, leads us to believe that those black and white squares do more to instill a feeling of digital exclusivity than anything else.

—————————

David Paul Strohecker (@dpsFTW) is getting his PhD from the University of Maryland, College Park. He is currently doing work on the popularization of tattooing, a project on the revolutionary pedagogy of public sociology, and more theoretical work on zombie films as a vehicle for expressing social and cultural anxieties.

David A. Banks (@DA_Banks) is a M.S./Ph.D. student at Rensselaer Polytechnic Institute.  His research interests include space, place, cyborgs, and networked bodies.  He is currently working under the NSF’s GK-12 fellowship program, teaching science in urban school districts and developing new learning technologies. More at www.davidabanks.org.

Strokecker and Banks both blog at Cyborgology.

If you would like to write a post for Sociological Images, please see our Guidelines for Guest Bloggers.

There are few social facts that spread themselves out evenly across social class. Most everything — how healthy we are, what we do for leisure, how we dress, etc — is correlated with income.  Twitter, I learned today, is an exception.   According to a Pew study, internet users across a wide array of income brackets are using Twitter at about the same rate.

Income and % of internet users who use Twitter:

When we look at variables that correlate with income, however, such as race and education, we see an uneven distribution.

Race and % of internet users who use Twitter:

Education and % of internet users who use Twitter:

So people with more education are more likely to use Twitter, but Whites (who, on average, get more education than Blacks and Hispanics) are less likely.  There’s something really interesting going on here.  Any idea what?

Lisa Wade, PhD is an Associate Professor at Tulane University. She is the author of American Hookup, a book about college sexual culture; a textbook about gender; and a forthcoming introductory text: Terrible Magnificent Sociology. You can follow her on Twitter and Instagram.


Terri Oda, a PhD student in computer science, put together this fun and quick slideshow explaining why sex differences in math ability can’t explain why there are so few women in computer science. It’s great:

Found at Geek Feminism. Thanks to Peter S. for the submission!

Lisa Wade, PhD is an Associate Professor at Tulane University. She is the author of American Hookup, a book about college sexual culture; a textbook about gender; and a forthcoming introductory text: Terrible Magnificent Sociology. You can follow her on Twitter and Instagram.

If I ran the Federal scary anti-smoking image warning program, I might show smokers the list of health-related terms that show up most in the states with the highest cigarette smoking rates.

If you take the smoking rates by state, and throw them into the Google Correlate hopper, you can see the 100 search terms that are most highly correlated with that reported smoking behavior. That is, the terms that are most likely to be used in high-smoking states and least likely to be used in the low-smoking states.

Is the result just a lot of noise? Maybe, but I don’t think so. Here are the smoking-related terms in the top 100:

  • camel no 9
  • cigarette coupon
  • cigarette coupons
  • marlboro coupons
  • my time to quit
  • safe cigarettes
  • stopping smoking
  • time to quit
  • fire safe cigarettes
  • ways to stop smoking

So that’s good for face validity — a list of random search terms isn’t likely to have all those smoking terms on it.

But after the smoking terms, the thing that jumps out is the health-related terms. We know from the Google flu tracker that people search for their symptoms. So these caught my eye.

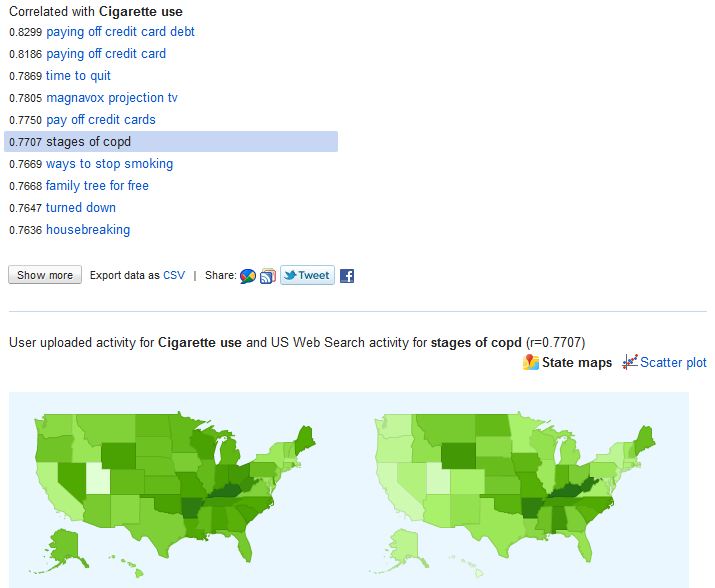
Here is a screen shot of the first page of results:

I selected “stages of copd” as the term to map. The map on the left is the smoking rates; the one on the right is the relative frequency of searches for “stages of copd.” That is, chronic obstructive pulmonary disease, a nasty disease the most common cause of which is smoking.

Here is the complete list of health-related terms among the top-100 correlates with smoking rates:

Lymph node swelling, which is implicated in the jaw and neck searches, most often reflects infection — which smoking causes.

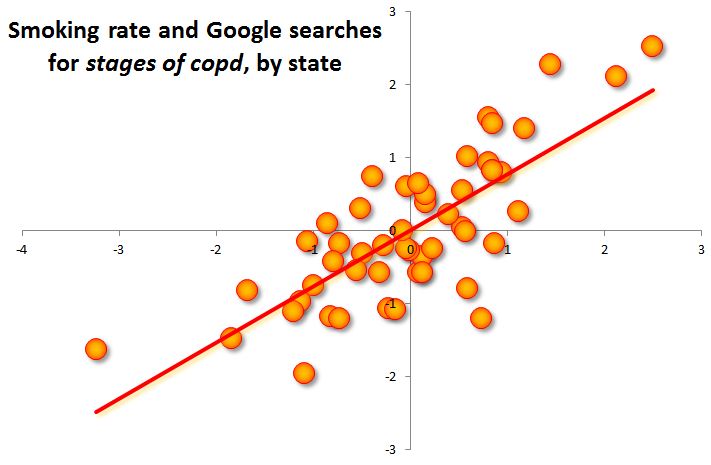
How strong are the connections? They’re not the strongest I’ve seen on Google Correlate. The “stages of copd” search is correlated with smoking rates at .77 on a scale of 0 to 1. It’s not uncommon to find correlations of .93 (which is the relationship between “quiche” and “volvo v70 xc”).

But considering the smoking rates come from a sample survey (the National Survey on Drug Use and Health) which includes random error, and states are somewhat arbitrary geographic units, that correlation seems pretty high to me. Here’s the scatterplot:

What is the correlation causality story here? I can’t say. But the simplest explanation is that these are the terms smokers (and maybe those who know or care for them) are most likely to Google relative to non-smokers — not that they are the most common searches smokers do, of course, but the searches that differentiate them from non-smokers. The simplest explanation is the best place to start.

I like this list of conditions because in my experience smokers sometimes have the attitude of “you have to die of something.” But it’s not just the chance of dying that smoking increases — it’s a lot of possible forms of suffering along the way.

——————————

The Google Correlate tool is showing the great potential for using Internet search activity to investigate layers of behavior and meaning behind other observable social phenomena, such as race/ethnic compositionhealth behavior, and family patterns.

That’s Facebook founder Mark Zuckerberg and, behind him, his “law of information sharing.” The equation and graph illustrate, in his own words:

…that next year, people will share twice as much information as they share this year, and next year, they will be sharing twice as much as they did the year before.

The norms surrounding privacy are changing and new apps and services for us to display ourselves are being invented. Because of this, Zuckerberg predicts that we will share more and new types of information as time passes.

Facebook and the rest of social media (Twitter, Tumblr, Google+ and so on) need us to share more and more information. Facebook, for instance, uses our personal information to attract advertisers who want to better “target” their advertisements to us. Change your relationship status to “engaged” and you may be quickly targeted with wedding ads.

So what? 

Karl Marx said that we are “exploited” when we are not paid in wages the full value of our labor (our bosses, instead, skim some off the top).  Since our sharing makes Facebook valuable, it is our work that makes it the digital goldmine that it is (valued at around $84 billion). We, in turn, are paid no wages at all.

Should the average Facebook user feel exploited? 

Facebook users get non-monetary rewards from using the site, such as self-expression and socializing with others.  Perhaps personal connection or social attention is just another type of currency, one that Marx didn’t fully account for.  Then again, Marx never argued that workers weren’t compensated at all, only that their compensation was not equal to the value they brought to the employer.

So, what do you think? Is Facebook exploitative? Are monetary and social currencies fundamentally different?

Does a Marxist analysis work on Facebook? Or do we need a different theory to make sense of it all?

——————————

Nathan Jurgenson is a graduate student in sociology at the University of Maryland and co-edits the Cyborgology blog.

If you would like to write a post for Sociological Images, please see our Guidelines for Guest Bloggers.

Cross-posted at Scientopia.

The introduction of the internet has made pornography more easily available than any time in modern history.  Responding to this development, some have worried that adolescents are looking at and watching porn, and plenty of it.

Is this true?

Drawing on a telephone survey of 1,500 youth, Janis Wolak and colleagues present some data giving us a clue.  They find that less than half (42%) of 10- to 17-year-old internet users had seen online pornography in the last year.  Most of them that had, further, had not sought it out.  The majority (66%) had come across the pornography by accident (e.g., they had entered a porn site without meaning to, been emailed an explicit image, or seen a pop up).

The image below shows unwanted and wanted exposure to pornography for boys as they age.  Only 1% of the boys 10- to 11-years-old had sought out pornography, by 12-13 about one in ten have done so, and by 16-17 over 1/3rd have (38%).  Unwanted pornography is a problem for boys of all ages. Seventeen percent of boys 10-11 encountered unwanted porn and this number increased as the boys aged.

Few girls seek out pornography: 2% of 10- 11-year-olds had sought out pornography, rising to 8% by 16-17.  Girls have the same problem with unwanted exposure to pornography; it happens about as frequently as it does for boys among 10- 13-year-olds and even more often among 14- 17-year-olds.

So there’s some data.  Whether it justifies the hand-wringing is for you to debate in the comments.

Source: Wolak, Janis, Kimberly Mitchell, and David Finkelhor. 2007. Unwanted and Wanted Exposure to Online Pornography in a National Sample of Youth Internet Users. Pediatrics 119, 2: 247-257.

Lisa Wade, PhD is an Associate Professor at Tulane University. She is the author of American Hookup, a book about college sexual culture; a textbook about gender; and a forthcoming introductory text: Terrible Magnificent Sociology. You can follow her on Twitter and Instagram.