international comparisons

Greg Mankiw, a big shot economist (he was the chairman of President Bush’s Council of Economic Advisors) had a brief blog post on Monday comparing European countries and the US. It’s part of a long-standing debate about the relative merits of European-style social democracy. The left wants the US goverment to do more to reduce inequalities (ensuring universal health care, for example, or providing benefits for the unemployed, and the poor, requiring employers to offer paid maternity leave, etc.). Those on the right argue that these policies would stifle the economy. They offer an economic picture of America the dynamic, Europe the stagnant.

The volume on that debate got turned up by an article by Jim Manzi in National Affairs. He refers to “government policies — to reduce inequality or ensure access to jobs, education, housing, or health care — that can in turn undercut growth and prosperity.”

Paul Krugman, in his column on Monday, rejected this idea:

The real lesson from Europe is actually the opposite of what conservatives claim: Europe is an economic success, and that success shows that social democracy works.

Greg Mankiw gives some data on GDP per capita, adding with a sly grin, “Readers of today’s column by Paul Krugman might find these figures useful to keep in mind.” He gives the data for “the United States and the five most populous countries in Western Europe.”

We’re number one. We’re way ahead – 30% higher than the UK next in line. Mankiw wins; Krugman loses. Case closed. Or is it?

I’m sure there’s a good economic reason for this cherry-picking choosing only the five largest cherries. But if you were curious about some of the insignificant countries in Europe and elsewhere, you might want to take a look at the entire list. Here’s an expanded chart:

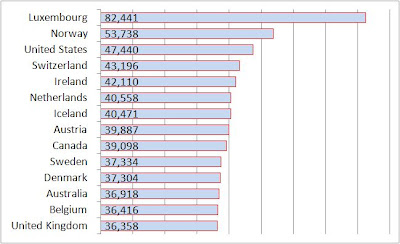
It turns out that among the non-Asian industrial democracies, there are a few countries that fall in that $11,000 gap between the US and UK. And when you include all those countries, the US is no longer number one.

The figure below, sent in by Muriel M.M. and Josh P., shows the relationship between health care spending (on the left) and life expectancy (on the right). Perhaps the most stunning finding is what appears to be a rather loose correlation between the two. But a second finding is the inefficiency of U.S. spending (see it at the left top of the figure?): it is far above the other states included and is, nonetheless, translating into less-than-stellar results (if you measure by life expectancy).

6a00e0098226918833012876674340970c-800wi

Via National Geographic.

Lisa Wade, PhD is an Associate Professor at Tulane University. She is the author of American Hookup, a book about college sexual culture; a textbook about gender; and a forthcoming introductory text: Terrible Magnificent Sociology. You can follow her on Twitter and Instagram.

When we consider how well we are doing financially, we must choose a referent.  That is, when we ask the question (“How well am I doing?”), we are also, simultaneously choosing a comparison group (e.g., people in our profession, people of our same sex, people our age, etc).

Most of us probably also restrict our considerations to people in the same country.  We usually don’t think about how well we are doing compared to all human beings in the world, but this website allows us to do just that.  If you put in your yearly income, it will show you where you rank on a global scale (Yen, Canadian dollars, U.S. dollars, Euros, and Pounds only, unfortunately).

I put in the median yearly income for a full time worker in the U.S. and this was the calculation:

Capture

This, of course, doesn’t consider the cost of living differences, but it still offers an interesting perspective.

—————————

Lisa Wade is a professor of sociology at Occidental College. You can follow her on Twitter and Facebook.

Visual Economics posted a (mildly) interactive page comparing what percentage of their budget different nations spend on health, education, and their military. The three screenshots below are for health:

3

4

5

You can also look at the data via a list.  This data is the percentage of the budget spent on the military:

2

Via Look At This.

—————————

Lisa Wade is a professor of sociology at Occidental College. You can follow her on Twitter and Facebook.

The Pew Forum on Religion & Public Life just released the results of a global study of Muslims. The interactive map lets you hover over a country and see what percent of its population is Muslim, and what percent of all Muslims reside there. It will be a surprise to many people to see what a small proportion of Muslims live in Arab countries.

Muslims

This map weights each country by population size (larger version here):

world-distribution-weighted

By region:

Pie-chart

Full report here.

The answer to that question matters because, even if bloggers don’t have the ability to control what we think, they do, to a certain extent, shape what we think about.  And bloggers can sometimes make enough noise to be heard.

Kay Steiger drew my attention to the findings of a study of the blogosphere by Technorati.  Below are a selection of their findings, click over for more on who blogs and answers to other interesting questions:

3905002482_b7ef56e56f

chart-p1-location-2

chart-p1-salary

table-p1-usbloggers

—————————

Lisa Wade is a professor of sociology at Occidental College. You can follow her on Twitter and Facebook.

This graphic, found at ChartPorn, compares the average number of work hours per year and per week across selected countries.  After the graphic, I listed the countries in order just for fun.

3797144896_e5abba1cd0_o

hours/country

27 Germany
27 Netherlands
27 Norway
30 Belgium
30 France
31 Ireland
31 Denmark
31 Spain
31 Sweden
32 Austria
32 Switzerland
32 U.K.
33 Australia
33 Canada
33 Finland
34 Japan
34 New Zealand
34 Portugal
35 Iceland
35 Italy
35 Slovakia
35  U.S.
36  Mexico
38 Czech Republic
38 Hungary
38 Poland
41 Greece
44 South Korea

—————————

Lisa Wade is a professor of sociology at Occidental College. You can follow her on Twitter and Facebook.

Jerry F. sent us a link to a neat interactive website where you can look at global GDP per capita by country, region, predominance of Buddhism/Islam/Christianity, language spoken, and so on. The data come from the 2008 CIA World Factbook.

The country with the highest GDP per capita? That would be itsy-bitsy Liechtenstein:

Picture 1

Much of Liechtenstein’s economy is linked to its popularity as a place to register holding companies because of low business taxes, so the exceedingly high GDP is probably a result of that. With a GDP of $103,500, Qatar is the second wealthiest nation.

Compare that snapshot of part of the Europe graph to this one for countries in the Horn of Africa:

Picture 2

From what I could tell, the lowest per capita GDP is in Zimbabwe: $200. Only one country on the entire African continent (Equatorial Guinea) breaks $20,000. The shockingly low GDPs in Africa, which indicate a continued lack of industrial (or any other) development, is the most striking pattern. Poor countries in Asia and South America seem downright wealthy by comparison.

As with any international database, I’m sure there are weaknesses with the Factbook–if nothing else, the difficulty of collecting meaningful, comparable data for all countries. I’d pay attention to the overall pattern rather than the specific dollar amount for any one country. If any of you have specific knowledge of the strengths and weaknesses of the CIA Factbook, let us know in the comments.

And also, of course, these numbers tell us nothing about how national wealth is distributed within each country. The average standard of living might be better in a country with a lower GDP where wealth is more evenly distributed across the population than in a “richer” country where a small group controls a highly disproportionate amount of wealth.

Related posts: military spending as a % of GDP, map of global use of electric lights after dark, carbon dioxide emissions per country, questioning the developed/undeveloped binary, international disproportions, and inequality in affluent nations.