history

In addition to differences in income, there is a persistent wealth gap between black and white families in the U.S. The term “wealth” refers to all of your assets (the home you own, money in savings and investments, etc) minus your debt. According to a new research and policy brief by Thomas Shapiro, Tatjana Meschede, and Laura Sullivan, the wealth gap has increased from $20,000 in 1984 to $95,000 in 2007.

The authors explain the growth in the gap this way:

The [increase in the] racial wealth gap… reflects public policies, such as tax cuts on investment income and inheritances which benefit the wealthiest, and redistribute wealth and opportunities. Tax deductions for home mortgages, retirement accounts, and college savings all disproportionately benefit higher income families.

There are also much variety in how much wealth is held by people within any given race. The figure below, shows that the gap between high-income and middle-income whites has tripled since 1984. Both groups, however, have seen an increase in the amount of wealth they hold.

In contrast, the wealth of middle-income black families has stagnated and the wealth of high-income black families has recently dropped, flattening differences in wealth among middle- and high-income blacks, but dramatically increasing the wealth gap between blacks and whites.

So why don’t we see an increase in the wealth gap among blacks? The authors point to “…the powerful role of persistent discrimination in housing, credit, and labor markets.”

For example, African-Americans and Hispanics were at least twice as likely to receive high-cost home mortgages as whites with similar incomes. These reckless high-cost loans unnecessarily impeded wealth building in minority communities and triggered the foreclosure crisis that is wiping out the largest source of wealth for minorities.

The authors conclude:

Public policies have and continue to play a major role in creating and sustaining the racial wealth gap, and they must play a role in closing it.

Hat tip to Philip Cohen, Family Inequality.

—————————

Lisa Wade is a professor of sociology at Occidental College. You can follow her on Twitter and Facebook.

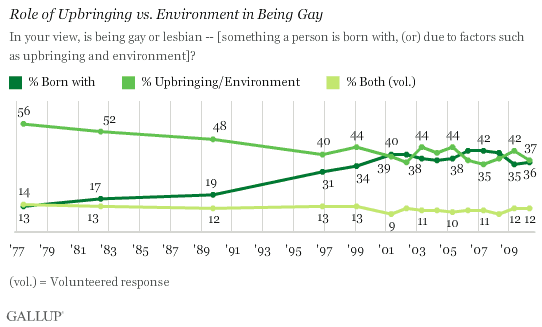
A blog post at Gallup, sent along by Michael Kimmel, discussed nearly 25 years of US opinion on the cause of homosexuality.  The data shows a slow decline in the percent of people who think that people are “made” gay or lesbian by their upbringing or environment (the nurture argument) and a slow rise in the number of people who think they are “made” gay or lesbian by biology (the nature argument).  The two meet in the late 1990s and, throughout the 2000s, they’ve been more-or-less neck-and-neck.

I welcome speculation as to why the trend didn’t continue such that nature ended up beating nurture good by 2010.  I can’t think offhand of a reason why.

—————————

Lisa Wade is a professor of sociology at Occidental College. You can follow her on Twitter and Facebook.

The new Pew Research Center report on the changing demographics of American motherhood (discovered thanks to a tip by Michael Kimmel) reveals some pretty dramatic changes in the ideal family size between 1990 and 2008.  In the late 1960s and early ’70s, two suddenly overtook three and four or more and it’s never looked back:

Here are today’s preferences (notice how few people want to remain childless or only have one child):

I’d love to hear ideas as to why this change happened at that moment in history.  Is it possible that the introduction of the contraceptive pill, which was the most effective method of contraception that had ever been available to women (I think that’s true), made smaller families an option and that people became interested in limiting family size once they knew that could actually do it?

Interestingly, people still overwhelmingly say that they want children because they bring “joy.”  But apparently two bundles of joy are enough!

UPDATE! A number of commenters have pointed out that both I and the authors of the study are conflating people’s opinions about ideal family size and the number of children they personally want to have (see the second figure especially).  I think they’re right that asking the question “What is the ideal family size?” will not necessarily get the same response as “How many children do you want to have?”   A very nice methodological point.

For more on this data, see our posts on age and racetrends in American motherhood.

—————————

Lisa Wade is a professor of sociology at Occidental College. You can follow her on Twitter and Facebook.

War is always an opportunity for someone, many someones, to make money. A recently closed ebay auction sold a pair of Converse shoes manufactured and sold during World War II. If I understand the description right, the shoes were sold to overseas servicemen who wanted to “stomp” on the Nazis; alternatively, they were sold to Nazis (I think the former).

The shoes:

And, the kicker, the soles:


UPDATE! In the comments Joe C. linked to a website, aryanwear.com, where you can buy these:

Via BoingBoing.  See also our post on the surprising history of the symbol.

—————————

Lisa Wade is a professor of sociology at Occidental College. You can follow her on Twitter and Facebook.

Dan S. alerted us to an image, purportedly of an article from the May 13, 1955, episode of Housekeeping Monthly. In it there is a photo of a woman bending over an oven with a list of tips for being a good wife, such as “a good wife always knows her place.” We’ve gotten this image before and never posted on it, much like the list on “How to Be a Good Wife,” attributed around the web to a “1950s home economics textbook.”

So why haven’t we posted the image before? Because it’s a fake. According to Snopes, the list was circulating widely on its own long before it suddenly appeared with the damning image…which is a completely unrelated image from a cover of John Bull magazine (not Housekeeping Monthly) that appeared in 1957, not 1955. Notice the text along the upper right corner of the image–it says “Advertising Archives.” According to Snopes, no one has ever turned up the economics textbook the “How to Be a Good Wife” list supposedly comes from, either.

So what gives? Why do these hoax 1950s-era images/lists keep appearing? I think Snopes makes an interesting case:

It has become fashionable to portray outdated societal behaviors and attitudes — ones we now consider desperately wrongheaded — to be worse than they really were as a way of making a point about how much we’ve improved. When we despair over the human condition and feel the need for a little pat on the back, a few startling comparisons between us modern enlightened folks and those terrible neanderthals of yesteryear give us that. We go away from such readings a bit proud of how we’ve pulled ourselves up by our bootstraps and with our halos a bit more brightly burnished.

The juxtaposition of wonderful modernity with a tawdry past also serves to reinforce the ‘rightness’ of current societal stances by  making any other positions appear ludicrous. It reminds folks of the importance of holding on to these newer ways of thinking and to caution them against falling back into older patterns which may be more comfortable but less socially desirable. Such reinforcement works on the principle that if you won’t do a good thing just for its own sake, you’ll surely do it to avoid being laughed at and looked down upon by your peers.

A typical vessel for this sort of comparison is the fabricated or misrepresented bit of text from the “olden days,” some document that purportedly demonstrates how our ancestors endured difficult lives amidst people who once held truly despicable beliefs.

Of course, as the Snopes article goes on to discuss, all kinds of very sexist stuff existed in the ’50s, and there were home-ec textbooks, magazines, etc., that included suggestions along the lines of those listed above.

Given that, it’s not shocking that when we see images of this sort, they immediately seem authentic, and get re-posted around the web despite the sketchy aspects of their origin stories. It’s not like we’ve never posted anything on Soc Images that we later figured out was a hoax (we also get things that we hope, desperately, are hoaxes but turn out to be real).

So there’s a truth behind the general gist of these types of lists, but many of the images themselves are fakes, created to make fun of our hopelessly, and hilariously, sexist past. And given how many real examples of sexist propaganda you could find from the 1950s, it’s worth pondering we find so many fake ones, and how, for some people, they may function to delegitimate concerns about gender inequality or sexism today, because come on, ladies — look how much better we have it than our grandmas did!

Gwen Sharp is an associate professor of sociology at Nevada State College. You can follow her on Twitter at @gwensharpnv.

Data from The Institute for College Access and Success shows that the number of students who graduate with at least $40,000 in student loans increased nine-fold between 1996 and 2008.

Sally Raskoff at Everyday Sociologyoffers some explanations for the data:  (1)  College has been getting more expensive; among other reasons, states cut education budgets.  (2)  For-profit colleges have also become a larger proportion of all colleges and students in these colleges are more likely to take out loans.   (3)  Given a bad economy, students are less likely to have jobs while in school.  Other explanations?  Stories?

Lisa Wade, PhD is an Associate Professor at Tulane University. She is the author of American Hookup, a book about college sexual culture; a textbook about gender; and a forthcoming introductory text: Terrible Magnificent Sociology. You can follow her on Twitter and Instagram.

A full-time worker making nine dollars an hour cannot raise a family above the poverty line.  A paper by Sheldon Danziger and David Ratner demonstrates that fewer women survive on less than $9 an hour today than (its adjusted equivalent) in 1979.  The same cannot be said for men: The authors write:

…changes in the labor market over the past thirty-five years, such as labor-saving technological changes, increased globalization, declining unionization, and the failure of the minimum wage to keep up with inflation, have made it more difficult for young adults to attain the economic stability and self-sufficiency that are important markers of the transition to adulthood.

This is just more evidence of the shrinking of the middle class; solid working class jobs that will allow you to buy a modest home are disappearing. Hat tip to Family Inequality and Karl Bakeman’s blog.

Lisa Wade, PhD is an Associate Professor at Tulane University. She is the author of American Hookup, a book about college sexual culture; a textbook about gender; and a forthcoming introductory text: Terrible Magnificent Sociology. You can follow her on Twitter and Instagram.

This graph, from Flowing Data, shows the obesity rates of different generational cohorts as they age.  Each differently colored lines represents people who were born in different decades (between 1926 and 1935 and on up).  Ascending lines represent higher percentages of obesity.  Horizontal progress represents age.

So, first things first: rates of obesity go up as a cohort ages.

What else?

People born after 1975 are starting out with higher rates of obesity than people born between 1956 and 1975.

And.

Obesity rates seem to rise at a pretty consistent rate as cohorts age.  So, if a cohort starts out with a high rate of obesity, they will have an ever higher rate 10 years later, and an even higher rate ten years after that, and so on.

The consequence:  Higher rates of obesity overall for each cohort that follows the last.

The data for the most recent cohort, born between 1996 and 2005, however, looks like it might be bucking the trend.

Lisa Wade, PhD is an Associate Professor at Tulane University. She is the author of American Hookup, a book about college sexual culture; a textbook about gender; and a forthcoming introductory text: Terrible Magnificent Sociology. You can follow her on Twitter and Instagram.