education

Katrin brought our attention to a report from the Brookings Institution about the educational levels of immigrants to the U.S., based on data from the 2009 American Community Survey as well as Census data between 1900 and 2000. As a group, immigrants have significantly more education than common stereotypes might lead you to believe. In fact, there are now more immigrants with at least a 4-year college degree than with less than a high-school diploma (27.8%):

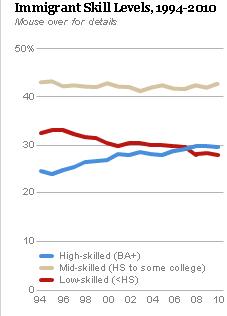
Overall, immigrants still have lower levels of education than native-born U.S. citizens. While the proportion with a college degree is comparable (32% of the native-born and 29.6% of immigrants have a 4-year degree or higher), the immigrant population is much more likely to have less than a high school diploma (27.8% vs. 7% for the native-born).

The proportion of immigrants falling into the high- or low-education categories varies significantly by destination city. The study authors calculated the ratio of high-skill to low-skill immigrants  (where skill is defined as education level, as in the graph above) for the 100 largest metro areas. High-skill destinations have more than 125 college-educated immigrants per 100 immigrants with less than a high school diploma; low-skill cities have fewer than 75. A city was defined as “balanced” if there were between 75 and 125 high-skill immigrants per 100 low-skill immigrants.

A map of the ratios shows that of the 100 largest metro areas, those in the eastern half of the U.S. (especially the Northeast) attract more educated immigrants, while the Great Plains and West (especially California, Arizona, New Mexico, and Texas) have lower-educated immigrant population. Balanced-skills cities are concentrated in the Midwest and Southeast:

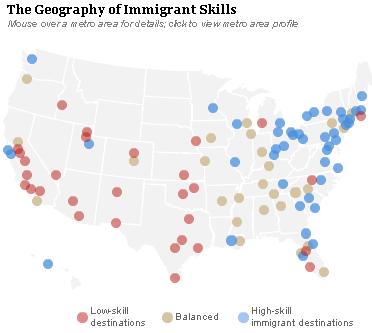
Not surprisingly, cities with universities attract more  highly-educated immigrants, while those with economies based on agriculture or food processing are more likely to be destination sites for immigrants with less education.

Here’s a video of one of the authors, Audrey Singer, discussing the study and its implications:

You can also see the detailed information about the 100 largest metro areas. In the areas studied here, immigrants with less than a high school diploma are disproportionately from Mexico (57.3%, but with wide geographic variation — Mexican immigrants make up only 6.2% of low-skill immigrants in Buffalo but 85.8% in Austin), lack English skills (only 16.4% are proficient), and are unlikely to be naturalized citizens (26.2%). Among immigrants with a college degree, 5.5% are Mexican, 71.5% are English-proficient, and 54% are naturalized citizens. The full report has a detailed discussion of the factors at play here–historical immigrant settlement patterns, changes in which cities are gateways for arriving immigrants, and so on. If you’re interested in immigration issues and how they impact economic development, it’s definitely worth a read.

Over the past few months, a number of readers have sent in examples of college-related advertising with a distinctly sexual theme.  There’s something interesting here. College pursuit, preparation, and achievement are being conflated with sexual prowess (the size of one’s dick, no less).  I suppose it was never was really about smarts.  Still, the overt conflation of (masculine) sexual superiority with academic achievement seems new to me. Am I wrong?

Scott M. and Ed A-N. sent in which penis size is used as a proxy for preparedness for the LSAT:

Stephanie A. sent in this ad for MyEdu, a college management site (whatever that is) that makes an obvious reference to Viagra (the little blue pill that makes for not-so-little erections):

Last but not least, Becky E. and Monica Y. sent in this facebook ad encouraging women to apply to a school loan by suggesting that very-sexy-ladies do the same:

See also our post: using sex to sell the most unlikely things (like organ donation!).

Lisa Wade, PhD is an Associate Professor at Tulane University. She is the author of American Hookup, a book about college sexual culture; a textbook about gender; and a forthcoming introductory text: Terrible Magnificent Sociology. You can follow her on Twitter and Instagram.

Cross-posted at Montclair SocioBlog.

Is a university admissions office the same as the basketball team?  Should selecting an entire student body for the college be like selecting players for the varsity?

Remember that kid at UC Merced, the one who argued that the graduated income tax was like redistributing GPA points? He found students who supported a graduated income tax and programs for the poor but who wouldn’t sign his petition to redistribute GPA points from the A students to those with lower GPAs. None of the students could articulate, on the spot, their reasons for not signing the GPA petition (assuming that he didn’t edit out any who did offer a reasonable explanation). (My earlier post on it is here.)

He’s baaaack. This time he’s asking students to sign a petition for affirmative action in sports – specifically to give preference to whites trying out for the team. Get it? If you support affirmative action in college admissions but not in sports, you’re a hypocrite. As before, students support one use of race preference but not the other, and as before none can give a convincing reason. The students all say, “It’s different,” but they can’t explain why.*

(To save time, I’ve set the video to start near the end – most students say the same thing. To see the whole thing, just drag the slider back to 0:00.)

Nyahh, nyahh – you’re for preferences for blacks where they’re a minority but not for whites where they are the minority. You’re a hypocrite.** Either that, or your thinking has been muddled by liberal ideas, which is pretty much the same thing, isn’t it?

The video concludes with the dictum that college admissions and sports should be the same. “Race-based preferences are wrong.” Ah, moral clarity.

Is college really the same as a sports team? They are certainly different in their consequences. If you’re a student now, in the coming years when you apply for a job, will HR ask you if you played varsity? Maybe. But unless the job you’re applying for is power forward, your answer won’t matter very much. But HR will absolutely want to know if you have a college degree. And your answer will matter. A lot.

Sports and school are different in another important way. Schools seek out minorities more for the sake of campus diversity than for the benefit of individuals. Yale probably gives preference to applicants from Montana or Mauritania over those form Manhattan. (Yale also might give preference to a power foward if the team this year is short of guys who can work the low post.) The purpose of this admissions policy is not to benefit Montanans (or power forwards) but to provide other students with the experience of living with a diversity of people (and to provide the basketball team with the right diversity of skills).

That same goal of demographic diversity does not apply to the competitive teams or the glee club or orchestra for that matter because those groups have a much more narrowly defined task. It’s that difference in purpose, rather than the difference in which race gets helped, that underlies the responses in the video. Take those same liberal students who support admissions policies that bring more blacks to campus; ask then if they would also support race-based preferences to get more blacks into crew, the glee club, or the chess team. I’m sure they would say no. As in the actual video, they would probably be unable to explain why giving preference to African Americans is acceptable in admissions but not activities.

They’ll say that the two are different, even though they can’t immediately explain why. Does that make them hypocrites, natural or un-?

The next time someone shoves a microphone in your face and asks for a justification for some distinction you make, smile at the camera and say, “As Michael Polany wrote in The Tacit Dimension, ‘we know more than we can tell,’ an insight that Richard Nisbett later developed with much social science evidence in his book Knowing More than We Can Tell.” See if you make it into the version that gets posted on YouTube, or into Robin Hanson’s blog.**

————————-

*I had assumed that the petitioner and his camera people were students at Merced. But in this new video, he’s at UCR.

** As with the previous video, Robin Hanson, on whose blog Overcoming Bias I found both of these, files the students’ attitudes in the folder marked “natural hypocrisy.”


(view the slideshow)

Back in the spring, Lisa gave a talk at Franklin and Marshall College about data about the newness, prevalence, and content of “hook ups” on American campuses. Surprise, today’s college students didn’t invent casual sex and there’s no need for their parents to worry about a “bacchanalian orgy” in one dorm after another.  Concluding that the problem isn’t “too much” sex, she argues that the problem is too much bad sex.

In her own research, Lisa has found that students want sex to be pleasurable, empowering, or meaningful.  But, alas, they seem to have difficulty achieving any one of those things in great measure.  The culprit, she concludes, isn’t hooking up, it’s hook up culture.  When a hook up culture dominates, all other ways of being sexual are repressed, and that leaves many students involuntarily celibate or having sex they don’t really want. The solution: an opening up of sexual options that allow students to truly, genuinely explore their own sexualities safely.

Franklin and Marshall College arranged to have the lecture filmed, but Lisa was too shy to post it on Soc Images. But she sent me the link to the talk, and I have no such misgivings. Unfortunately, the camera was set up at an angle where you can’t see the PowerPoint presentation that went along with the lecture, so you’ll have to look through it separately if you’re interested (slideshow and transcript if you’d rather read).  Lisa’s got other talks too, if you’re interested, and I know she loves giving them.

Common Hour: The Promise and Perils of Hook-Up Culture from Franklin & Marshall College on Vimeo.

Common Hour: The Promise and Perils of Hook-Up Culture from Franklin & Marshall College on Vimeo.

Sociologists have shown that rates of “obesity” correlate with economic class. That is, the poorer you are the more likely it is that you will be overweight.  This is, in part, because healthy, low-calorie food tends to be more expensive that calorie rich, nutrient poor food; and also because poor neighborhoods have fewer grocery stores, forcing the poor, especially if they don’t have cars, to shop for groceries at corner stores, gas stations, and fast food restaurants.  When there are so many other things to worry about, like not going hungry, food quality is not prioritized.  Level of fitness, then, correlates with social class (and the time and money it affords you) and the things that correlate with social class, like level of education.

The American College of Sports Medicine has released data showing these correlations, if measured at the level of U.S. metro areas, as reported at The Atlantic and sent along by Tracie Hitter, a doctoral student at New Mexico State University.  First, fitness level is correlated with average income in these areas:

Second, fitness level correlates with average level of education (here called “human capital”):

And fitness level correlates with overall well-being, a measure related to both fitness and socioeconomic class:

Here are some selected metro areas plotted in relation to one another:

Lisa Wade, PhD is an Associate Professor at Tulane University. She is the author of American Hookup, a book about college sexual culture; a textbook about gender; and a forthcoming introductory text: Terrible Magnificent Sociology. You can follow her on Twitter and Instagram.

In recent years, as states around the country have been faced with the worst budget deficits on record, funding for many social service programs has been slashed or cut entirely. A new report from the NAACP demonstrates that during these budget clashes, funding for prisons has won out over spending for education. The report argues that these “misplaced priorities” are ultimately destructive.  Expanding prisons at this point does little to reduce crime and by spending these limited budget dollars on prisons rather than education, we are condemning the next generation of kids in poor neighborhoods to this same cycle of poor education, high crime rates, and mass incarceration.

However, the NAACP report only describes the first half of the problem—the failures of schools and the expansive role of the criminal justice system. The other half of the story is the legacy of these failures—strikingly low levels of education among those who wind up in our nation’s prisons—and the fact that corrections departments today are doing a worse job than ever in providing education inside of prisons as a way out of the revolving door of corrections.

This is important because we know that over 90 percent of inmates are at some point released and roughly half of them will return to prison within the next 3 years. Slashing prison education funding may provide a very small benefit to the current budget, but it also helps to fuel the growth in prisons that has suffocated education funding in the first place.

It is simple to document the dire educational needs of prisoners.  According to the 2004 Survey of Inmates in State and Federal Correctional Facilities, over 60 percent of state inmates never made it past 11th grade in school.  Among young inmates under 25 years of age, only 20 percent have completed high school.  If G.E.D.’s are included in this measure, only 66 percent of inmates 25 years or older have completed their basic education, compared to 85 percent of adults in the non-institutionalized population.

Sadly, the programs that serve these inmates’ needs have been on the chopping block for years.  In work recently published in Law & Society Review, I show that the ratio of inmates to teachers for academic and vocational education in prisons nationwide has more than doubled since the 1970s, growing from 53 inmates per teacher in 1974 to 112 inmates per teacher in 2005. Much of this change occurred in the most recent decade: in 1990, the ratio was only 67 inmates per teacher.

These declines in staffing investments are clearly translating into declining participation in prison education programs. Between 1991 and 2004, the percent of inmates reporting past or current participation in academic classes dropped precipitously from 43 percent to 27 percent.  If the rate of high school attendance had dropped by almost 50% in the span of a decade and a half, pundits would be railing against state legislators.  But since this happened behind prison walls, there has been very little awareness (let alone outrage) about these changes.

This strategy is a flawed attempt to cut costs since we know that education is one of the more successful ways to reduce recidivism.  In study after study, inmates who participate in educational programming are less likely to commit new crimes after release and to be re-incarcerated. This is in part because basic academic education and vocational training makes it more possible for ex-felons to find the kind of employment opportunities that forestall re-incarceration.

In recent years, this disinvestment in prison education has been even more brutal. In California, state lawmakers have taken $250 million away from rehabilitation programs in the last two years and are planning to cut another $150 million in the coming year. These losses in funding translate into a third of the adult programming budget. These cuts are an ironic move after Governor Schwarzenegger’s 2004 decision to change the name of the state agency from the “Department of Corrections” to the “Department of Corrections and Rehabilitation”.

Although some states have begun looking into ways to reduce correctional populations as a more sustainable way to manage costs, in the next few years, we can expect to see even more slashes to prison education funding.  Ultimately, this strategy is likely only to cut a small percentage of states’ immediate costs and will increase the need for incarceration spending in the near future.

—————————

Michelle Phelps is a Ph.D. candidate in Sociology and Social Policy at Princeton University.  Her work focuses on the punitive turn in the criminal justice system, examining how the daily operations of prisons changed (and remained the same) during the massive recent shift in the rhetoric and politics of punishment.  Her dissertation project is on the rise of probation supervision and you can find her new blog on the strange media surrounding probation at Probation Research.

If you would like to write a post for Sociological Images, please see our Guidelines for Guest Bloggers.

Note: Since I posted this, Philip Cohen has brought up concerns about the National Marriage Project’s data and analysis in another study. You might want to take a look at his post.

Patricia P. sent in an infographic illustrating trends in marriage, divorce, and cohabitation over the last several decades, based on data from the National Marriage Project at the University of Virginia. I found several of the images to be a bit cluttered and unclear, but this one neatly summarizes the percent of women over age 15 who were currently married, 1960-2009:

I looked through the full 2010 The State of Our Unions report. This graph, showing the percent of those aged 15 or older who were married from 1960-2009, shows that marriage has become less common for both men and women, Blacks and Whites (based on U.S. Census Data):

Of course, this is in large part because people in the U.S. are getting married later; not only do we not really expect a 15-year-old to be married, we’d be rather horrified if they were. If we look only at adults aged 35-44, we do see a significant decrease in marriage between 1960 and 2009, but still, about 2/3 were married:

The report also includes a graph of the percent chance that a couple will divorce or separate within 10 years, broken down by education, for the early ’70s and the late ’90s (for first-marriage couples only). Least educated is defined as having less than a high school diploma; the moderately educated graduated high school but have less than a 4-year college degree; and the highly educated have a 4-year college degree or more:

Note that for both the least and most educated, the risk of divorce actually went down — though those with the least education are over three times as likely to separate/divorce than the highly educated.

On the other hand, rates of cohabitation have gone up:

Perceptions of marriage, not surprisingly, also vary by educational level, with the highly educated feeling significantly more positively about marriage than the less educated population. Asked if they agreed that marriage hadn’t worked out for “most people” they know, 53% of the least educated and 43% of the moderately educated said yes, while only 17% of those with at least college degrees felt similarly:

So the overall trend appears to be a growing gap between the highly educated and those with less than a 4-year college degree, with the moderately educated looking more similar to those with less than a high school diploma in terms of their marriage, divorce, and cohabitation behaviors. If you’re interested in this topic, check out the full report.

I have posted before about the ways those who handle the dead may try to humanize themselves so as to avoid the stigmas often associated with their jobs. Individuals who have jobs that require them to touch or be around dead bodies often find they are negatively stereotyped as creepy, gross, or as taking advantage of families in times of pain. They engage in various strategies to try to resist those stereotypes, including redefining the job and attempting to present it as something valuable and respectable (a “funeral director,” after all, sounds much nicer and more professional that “undertaker” or “mortician”).

In my previous post I discussed the Men of Mortuaries calendar, which presented shirtless male funeral directors in hunky poses. Now we have an example of women doing something similar. Christie W. sent in a link to the Funeral Divas website, which clearly tries to present women working in the funeral industry in a positive light:

From the site’s homepage:

A Funeral Diva is a strong, confident and successful woman who works in the funeral industry. She is not ashamed of her career! She is proud to serve hurting families!

So here, women who work in the funeral industry are hip, fun, successful career women — not creepy people who like being around dead bodies, and not individuals who profit from families’ grief.

Of course, in addition to presenting female funeral directors positively, the site also attempts to support women working in a field that has been male-dominated since preparing and burying our dead moved from an informal family activity to a formal business. However, women’s presence in this industry is growing. In 2008, the New York Times reported that women made up 35% of mortuary school students in 1995, while in 2007 60% were female; at some schools women make up nearly 75% of the student body. Interestingly, the article focuses on how the funeral industry has changed to include more concern for handling grieving individuals and, thus, the increased need for “the caring factor” — which presumably makes women seem like a better fit for the job, as they are assumed to be for other types of jobs that require lots of nurturing and emotional work.

Despite this, an article in the Christian Science Monitor discusses the barriers women in the industry continue to face. This year, New York’s Attorney General filed a lawsuit against one mortuary school, the Simmons Institute of Funeral Services, and its CEO, alleging repeated sexual harassment of female student and discrimination against pregnant women, a violation of Title IX.

So women in the funeral industry have to contend with the general negative stigma associated with their job, as well as the usual issues faced by women entering a previously male-dominated field. Funeral Divas is an interesting attempt to address both of these sets of problems at once.