economics

The Center on Budget and Policy Priorities ran the CBO data on income and published a report showing the huge increase in inequality since 1979, especially in recent years (the data go up to 2007 – full report here).  It’s the people at the top – the default swappers and hedge funders – who’ve been making out like bandits, while the rest of us limped slowly along.

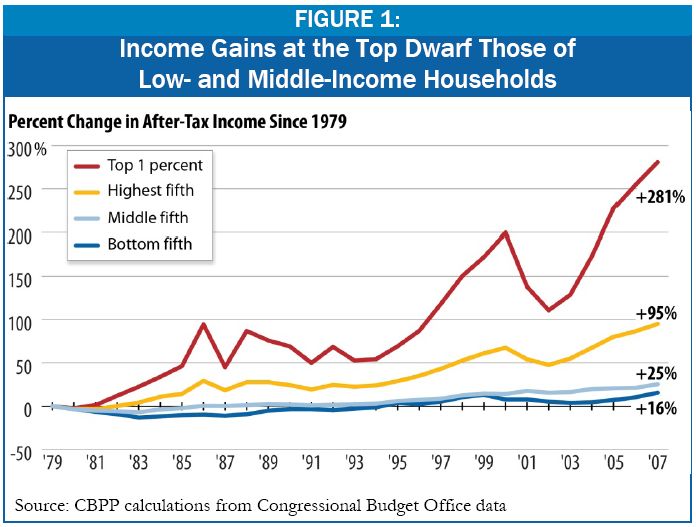
The graph shows percent changes. How much is that in American money?

We all knew this. But I’m still surprised that supposedly intelligent people can still attribute it all to individual factors. Yes, individual differences in ability account for individual differences.  But they don’t make for huge changes in the overall distribution.

But here we have Glenn Reynolds, Instapundit, one of the most widely read bloggers in the known universe (especially the conservative universe), reprinting the comment of a reader at a tax blog that posted the data.

A reason for the “wealth or income gap”: Smart people keep on doing things that are smart and make them money while stupid people keep on doing things that are stupid and keep them from achieving.

People who get an education, stay off of drugs, apply themselves, and save and wisely invest their earnings do a lot better than people who drop out of school, become substance abusers, and buy fancy cars and houses that they can’t afford, only to lose them.

We don’t have an income gap. We have a stupid gap.

Glenn calls it “the comment of the day.”

In 1993, the average household in the top 1% was making 36 times the income of a household in the lowest fifth. In the next 14 years, those top guys worked really hard while the poor apparently sold their diplomas to buy crack and Escalades, so by 2007 the gap had doubled. The richest now made 72 times the income of the poor.

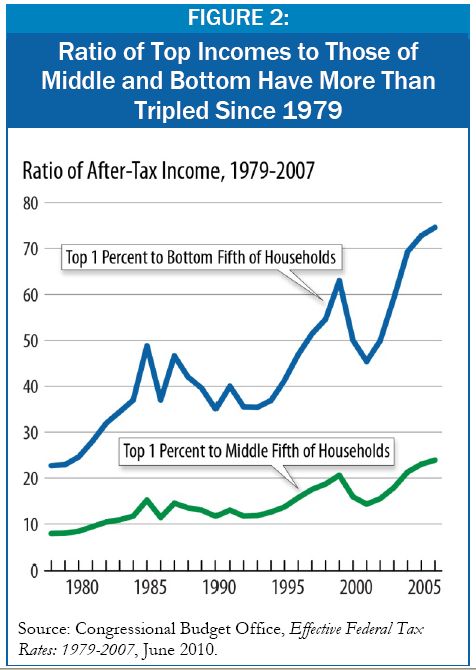
The funny thing is that for a few years (1984- 1983 1993) the rich-poor gap was decreasing. It must have been all the cocaine those bond traders were doing.

The commenter is right – there may be a stupid gap. But it’s the gap that Durkheim suggested long ago. Some people look at “social facts” – large differences between one time or place and another – and try to explain them in terms of individual facts. Other people seek an explanation in social facts – facts about the society, facts which individuals have little power to change.

(HT: Mark Kleiman)


We previously posted Annie Leonard’s breakthrough video, The Story of Stuff, and a follow up, The Story of Bottled Water. Kraig H. sent along another by Leonard on how cap and trade will not stop climate change:

Lisa Wade, PhD is an Associate Professor at Tulane University. She is the author of American Hookup, a book about college sexual culture; a textbook about gender; and a forthcoming introductory text: Terrible Magnificent Sociology. You can follow her on Twitter and Instagram.

Data from the Pew Research Center shows us the extent to which the recession has hurt the economic health of American households, especially the middle and working classes:

More than half of all Americans report some sort of work-related disruption:

Nearly half state that they are worse off than they were before the recession:

An additional four percent (since 2008) identify themselves as lower class:

Pew specifies:

Blacks, as a group, are an exception to this overall pattern. The share of blacks who now identify with the upper class has gone up during this recession, to 20% now from 15% two years ago.

Forty-eight percent have lost equity in their homes:

Sixty percent of Americans fear that they may have to delay retirement:

A larger percentage lack the confidence that they have enough income and assets for retirement, even compared to last year:

“Is America still a land of prosperity?”

The question in some historical perspective:

Lisa Wade, PhD is an Associate Professor at Tulane University. She is the author of American Hookup, a book about college sexual culture; a textbook about gender; and a forthcoming introductory text: Terrible Magnificent Sociology. You can follow her on Twitter and Instagram.

Pew Research Center has released data suggesting an age gap in optimism for the future of American young adults.

When asked if their children will be better off or worse off than they are, less than half of U.S. parents say “better off” and a full 25 percent say “worse off.”  This is the most pessimistic we’ve seen parents in 16 years.

But their kids are more optimistic than anyone else, with 85% saying that they expect that their financial situation will improve next year:

Of course these data aren’t entirely compatible, but it’s an interesting comparison nonetheless.  The idealism of youth?  The pessimism that comes with bad backs and mortgage payments?  The possibility that 18-29-year-olds have nowhere to go but up?

Economix, via Karl Bakeman.

Lisa Wade, PhD is an Associate Professor at Tulane University. She is the author of American Hookup, a book about college sexual culture; a textbook about gender; and a forthcoming introductory text: Terrible Magnificent Sociology. You can follow her on Twitter and Instagram.


Sociologist Geographer David Harvey’s analysis of the current economic crisis is engagingly illustrated in this 11-minute video.  Harvey evaluates individual, institutional, ideological, cultural, and policy explanations for the recession.  He then explains Marx’s insights into the “internal contradictions of capital accumulation”:  capitalists want to pay low wages, but if they’re paying low wages, then no one can buy their stuff.  If both high wages and low wages translate into no profits, where does that leave capitalism?

From Cognitive Media via BoingBoing and Karl Bakeman.

Buy Harvey’s book, The Enigma of Capital and the Crises of Capitalism.

Lisa Wade, PhD is an Associate Professor at Tulane University. She is the author of American Hookup, a book about college sexual culture; a textbook about gender; and a forthcoming introductory text: Terrible Magnificent Sociology. You can follow her on Twitter and Instagram.

Bundle presents the following infographic detailing how much people in various U.S. cities spend restaurants and groceries (some highlights below): The average household in the U.S. spends 37% of its food and drink budget in restaurants. In Hialeah, Florida, 69% of food and drink spending is spent on groceries instead of dining out; the largest proportion of spending in eating in. Atlanta is on the other side of the spectrum, with 57% of the food budget spent at restaurants. Households in Austin spend the most on food ($12,447) with more than half of that spent dining out. In contrast, people in Detroit spend the least ($2,246), As the graphic notes, “five average Detroit households can eat on one Austinite’s food budget.” On average, in U.S. households 17% of spending goes towards food and drink. The largest proportion of spending allocated towards food and drink is found in Denver (22%), but my city, Los Angeles, is not far behind (21%). Hat tip to Flowing Data.

Lisa Wade, PhD is an Associate Professor at Tulane University. She is the author of American Hookup, a book about college sexual culture; a textbook about gender; and a forthcoming introductory text: Terrible Magnificent Sociology. You can follow her on Twitter and Instagram.

The Center for American Progress released a report detailing the state of border policing and the projected impact of immigration policies.  First, notice that spending on border patrol and the number of border patrol agents in the southwest have increased significantly between 1992 and 2009:

Still, despite this, the number of people illegally crossing the border has increased:


So the policing hasn’t deterred a rise in disallowed border crossings, but it has made it more dangerous:

So, the U.S. is spending a lot of money trying to keep undocumented non-citizens out.  Is it worth it?

The report also discusses projected changes in the GDP under three different scenarios: immigration reform, allowing temporary workers only, and mass deportation.

The figure suggests that undocumented workers are making a substantial contribution to the well-being of the U.S. economy, one that would decrease under conditions of mass deportation.  Temporary workers are helpful, but real immigration reform that would bring in greater numbers of permanent and temporary workers is the best thing for America.

Hat tip to Graphic Sociology.

Lisa Wade, PhD is an Associate Professor at Tulane University. She is the author of American Hookup, a book about college sexual culture; a textbook about gender; and a forthcoming introductory text: Terrible Magnificent Sociology. You can follow her on Twitter and Instagram.

To me this New York Times graphic showing the relationship between gas prices and the average number of miles driven powerfully suggests that gas prices actually have little to do with how much driving Americans do.  The vertical axis is gas prices and the horizontal axis is the number of miles driven.  The line inside the figure is time.

Basically the illustration shows that the number of miles per year Americans drive has been climbing since 1956.  Despite short-term gas price fluctuations, something is driving us to drive more and more every year.

When gas prices do shoot up — such as during the oil embargo, the energy crisis, and the most recent peak — Americans show a  modest drop in driving, but it’s not a very large one and we recover rather quickly.  During the oil embargo, Americans shaved 210 miles a year off of their driving.  During the energy crisis, only 156.  The recent reduction in the number of miles driven per year is attributed by the New York Times writer to the fact that so many people are unemployed and, therefore, no longer need to drive to work.

Driving, then, shows only a modest response to high prices.  Perhaps the jumps in prices during these peaks — 43 and 106 cents per gallon respectively —  weren’t really worth slowing down for?  Or perhaps driving is so culturally meaningful that Americans are willing to pay to stay in their cars regardless?  Or maybe driving, and driving farther, has become increasingly important over time such that people can’t reasonably reduce the amount of driving they do?

It seems to me that the problem is at least partly infrastructural.  I wonder how average miles driven responds, or would respond, to enhancing and investing in public transportation?  If we started building denser neighborhoods and got rid of suburbs?

Flowing Data.

Lisa Wade, PhD is an Associate Professor at Tulane University. She is the author of American Hookup, a book about college sexual culture; a textbook about gender; and a forthcoming introductory text: Terrible Magnificent Sociology. You can follow her on Twitter and Instagram.