economics: history

In response to company pensions, employer age limits, shifts in the economy, and the initiation of social security, men have increasingly enjoyed a little 20th century social invention called “retirement.” In 1860, more than 80% of men age 70 to 74 worked, but by around 2000, that number had dropped to below 20%.

As of the 2000s, this more-than-100-year-trend of increasing numbers of men enjoying their “golden years” has reversed. This is your image of the week:

4

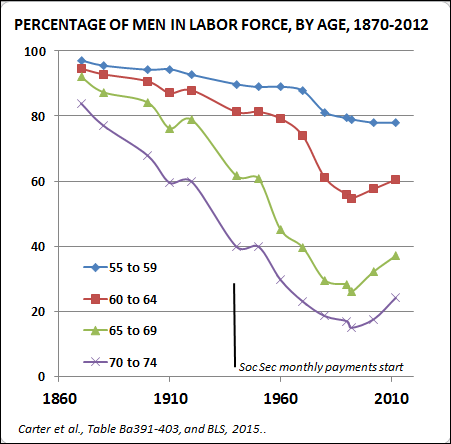
Over at Made in America, from where I borrowed this graph, sociologist Claude Fisher explains the reversal of the trend (citations at the link):

The private sources of retirement support, such as company pensions and investments, have weakened; [and] public sources of aid are under strain from a lower birth rate, a stagnating economy, and political retrenchment. And the years that such support must cover are growing. In 1990 a 65-year-old man could expect to live about 15 more years; in 2010, 18 more years. That’s an extra 20 percent of financing needed.

Among other things, the economic health of older Americans is an important sign of the overall health of the economy. It will be interesting to keep an eye on this statistic in the near future.

Lisa Wade, PhD is an Associate Professor at Tulane University. She is the author of American Hookup, a book about college sexual culture; a textbook about gender; and a forthcoming introductory text: Terrible Magnificent Sociology. You can follow her on Twitter and Instagram.

When one thinks of American Chinatowns, they usually think of San Francisco and New York, but at one time the third largest Chinatown in the U.S. was in Louisiana. It’s story is an example of how economics and geopolitics shape the growth of ethnic enclaves.

After the American Civil War ended legalized slavery in the U.S., Southern planters faced the challenge of finding labor to work their crops. It was common to employ the same black men and women who had been enslaved, now as sharecroppers or wage laborers, but the planters were interested in other sources of labor as well.

At nola.com, Richard Campanella describes how some planters in Louisiana turned to Chinese laborers. Ultimately, they hired about 1,600 Chinese people, recruited directly from China and also from California.

This would be a doomed experiment. The Chinese workers demanded better working conditions and pay then the Louisiana planters wanted to give. There was a general stalemate and many of the Chinese workers migrated to the city.

By 1871, there was a small, bustling Chinatown just outside of the French quarter and, by the late 1930s, two blocks of Bourbon St. were dominated by Chinese businesses: import shops, laundries, restaurants, narcotics, and cigar stores (some of the migrants had come to the U.S. via Cuba). Campanella quotes the New Orleans Bee:

A year ago we had no Chinese among us, we now see them everywhere… This looks, indeed, like business.

Big Gee and Lee Sing, New Orleans 1937 (photo courtesy of nola.com):

2

Other residents, it seemed, welcomed the way the Chinese added color and texture to the city. Campanella writes that “New Orleanians of all backgrounds also patronized Chinatown.” Louis Armstrong, who was born in 1901, talked of going “down in China Town [and] hav[ing] a Chinese meal for a change.” Jelly Roll Morton mentioned dropping by to pick up drugs for the sex workers employed in the nearby red light district.

A strip club now inhabits the old Chinese laundry; none of the original Chinatown businesses remain. But it held on a long time, with a few businesses lasting until the 1990s. All that’s left today is a hand-painted sign for the On Leong Merchants Association at 530 1/2 Bourbon St.

13

For more, get Richard Campanella’s book, Geographies of New Orleans.

Cross-posted at Pacific Standard.

Lisa Wade, PhD is an Associate Professor at Tulane University. She is the author of American Hookup, a book about college sexual culture; a textbook about gender; and a forthcoming introductory text: Terrible Magnificent Sociology. You can follow her on Twitter and Instagram.

This is a map of the countries Europe colonized, controlled, or influenced between 1500 and 1960. The purple is Europe. The orange countries are ones never under European rule. Almost the entire rest of the map — all the green, blue, and yellow — were dominated by Europe to some extent. “Influenced” is pretty much a euphemism and often not all that different than outright domination.

15

Max Fisher, writing at Vox, summarizes:

There are only four countries that escaped European colonialism completely. Japan and Korea successfully staved off European domination, in part due to their strength and diplomacy, their isolationist policies, and perhaps their distance. Thailand was spared when the British and French Empires decided to let it remained independent as a buffer between British-controlled Burma and French Indochina…

Then there is Liberia, which European powers spared because the United States backed the Liberian state, which was established in the early 1800s by freed American slaves who had decided to move to Africa.

More details and discussion at here.

Lisa Wade, PhD is an Associate Professor at Tulane University. She is the author of American Hookup, a book about college sexual culture; a textbook about gender; and a forthcoming introductory text: Terrible Magnificent Sociology. You can follow her on Twitter and Instagram.

If it were to happen that the decision as to whether the tomato was a fruit or vegetable made it to the highest court of the land — if such a strange thing were to happen — certainly the botanist’s opinion would weigh heaviest. Right?

Nope.

In fact, this decision did make it all the way to the Supreme Court. It happened in 1893. The case was brought by a tomato importing family by the last name of Nix. At the time, the law required that taxes be collected on vegetables that were imported, but not fruit.

The lawyers for the Nix family argued that the tomato is a fruit and, therefore, exempt from taxation. They were, of course, correct. Botanists define fruit according to whether it plays a reproductive role. So, any plant product with one or more seeds is a fruit, whereas vegetables don’t have seeds. Fruits are ovaries, for lack of a better term. All other plant products — stems, roots, leaves, and some seeds — are vegetables.

But the Supreme Court said, essentially, “We don’t care” and gave their gavel a good pound. Here’s some of the text of their unanimous opinion:

Botanically speaking, tomatoes are the fruit of a vine… But in the common language of the people, whether sellers or consumers of provisions, all these are vegetables which are grown in kitchen gardens, and which, whether eaten cooked or raw, are… usually served at dinner in, with, or after the soup, fish, or meats which constitute the principal part of the repast, and not, like fruits generally, as dessert.

The judges were referring to the common understanding, which has more to do with how we use the plant products than how plants use them. Your typical chef roughly divides plant products according to whether they’re sweet or savory. Fruits are sweet. Vegetables are savory and used for main courses and sides. It’s all about whether you eat them for dinner or dessert. And that’s what the Supreme Court upheld.

Culinary vs. botanical categorization (source):

2

Since the culinary scheme dominates our colloquial understanding, we mis-classify lots of other things, too. Zucchini, bell peppers, eggplants, string beans, cucumbers, avocado, and okra — all fruit. Rhubarb is a vegetable. No seeds. Pineapples are fruits. “Ah ha!” you say, “I’ve never noticed a pineapple having seeds!” That’s because commercial growers sell us seedless pineapples. Who knew. Berries are fruit, but strawberries, blackberries, and raspberries are not actually berries. Isn’t this fun?

Bruno Latour and Steve Woolgar, in Laboratory Life: The Social Construction of Scientific Facts, wrote:

If reality means anything, it is that which “resists” the pressure of a force. … That which cannot be changed at will is what counts as real.

We often think of cultural facts as somehow less real than biological ones. For the Nix family, though, biology mattered naught. They still had to pay the damn tax on their tomatoes. Culture is real, folks. Social construction is not just something we do to reality; for all intents and purposes, it is reality.

Cross-posted at Pacific Standard.

Lisa Wade, PhD is an Associate Professor at Tulane University. She is the author of American Hookup, a book about college sexual culture; a textbook about gender; and a forthcoming introductory text: Terrible Magnificent Sociology. You can follow her on Twitter and Instagram.

According to a June 2014 Russell Sage Foundation report, the average U.S. household experienced a real wealth decline of more than one-third over the 10 years ending in 2013.

Table 1 shows that the net worth of the median household fell from $87,992 in 2003 to $56,335 in 2013, for a decline of 36%.  In fact, the last ten years were hard on the overwhelming majority of American households.  Only the top 2 groups enjoyed wealth gains over the period.  Also noteworthy is the tiny net worth of households below the median.

1

Figure 1 provides a longer term perspective on wealth movements.  We can see that most households enjoyed growing wealth from 1984 to the 2007 crisis, with wealth falling across the board since.  However, the median household is now significantly poorer than it was in 1984.  Only the richer households managed to maintain most of their earlier gains in wealth.

2

These trends highlight the fact that we have a growing inequality of wealth, as well as of income, and they are not likely to reverse on their own.

Martin Hart-Landsberg is a professor of economics at Lewis and Clark College. You can follow him at Reports from the Economic Front.

By now most readers are likely familiar with the idea that the American middle class is shrinking.  Most income and wealth gains over the past 40 or so years have gone to the richest Americans, while poverty is spreading and getting deeper.  As a result, the percent of Americans who can reasonably claim to be middle class is shrinking.

I found a fantastic animation illustrating this process in the neighborhoods of the city of Chicago.  Borrowing data from education scholar Sean Reardon and sociologist Kendra Bischoff, Daniel Hertz calculated where the  median family income of each Census tract fell relative to the entire metropolitan area.  Orange tracts are ones where the median family income is 0-45% of the median for Chicago as a whole (struggling families), dark green tracts are ones where the median is 200% or more (resource rich families).  Grey is, literally, middle class.

For simplicity’s sake, here is 1970 and 2012 right next to one another.  Notice that the 1970 map involves a lot more grey (middle class) and the 2012 map involves a lot more green (rich) and especially orange (poor).

1


Here’s the animation:

1For another interesting measure of the shrinking middle class, see our post showing increases in high paying and low paying jobs, but decreases in jobs that pay middle income wages.

Lisa Wade, PhD is an Associate Professor at Tulane University. She is the author of American Hookup, a book about college sexual culture; a textbook about gender; and a forthcoming introductory text: Terrible Magnificent Sociology. You can follow her on Twitter and Instagram.

Do Millennials really carry more debt than their parents and grandparents did at their age? Yes, according to a new study by sociologist Jason Houle.  “In order to participate in society and gain economic independence,” he writes, “many young adults today must take a massive financial risk.”  Or, as he puts it, “out of the nest and into the red.”

The graph below compares the amount of debt held by three generations in young adulthood (adjusted for inflation and controlled for other variables). Notice that the median debt load has grown, but the average debt load has grown much faster. This means that, while debt has grown over all, averages are also pulled up by a small number of young people that have really high levels.

1 (2) - Copy

Some evidence suggests that high debt individuals may be coming from lower income families. They take on debt as young people because the adults in their lives have already maxed out. They can’t count on their parents, for example, to take out a second mortgage on the house in order to pay for their college education. So, if they want to go to college, they have to take on the debt themselves.

Houle’s analysis, however, also shows that the kind of debt has changed across the three generations. The pie charts below reveal that the proportion of debt accounted for by home or car loans has shrunk, while the proportion accounted for by education loans and unsecured debt, like credit cards, has risen.

1 (2)

Moreover, Houle argues that this profile of generation Y’s debt is class specific:

The more advantaged are able to take on debt that helps them pursue a middle class lifestyle and build their wealth, while the less advantaged must take on debt to pay their bills and keep their heads above water.

So, is massive financial risk the new recipe for success?

For some, the answer may be yes. But for many, the gamble does not pay off. Students that take out college loans, for example, are more likely to drop out of college than those who have a parent that can pay. The combination of school loans and minimum-wage jobs can add up to a lifetime of economic insecurity. But, without other resources, not risking at all almost guarantees failure in this economy.  For this reason, Houle argues, the availability of credit and acquisition of debt may be just another driver of income and wealth inequality.  It’s a disturbing story that you can read in more depth here.

Lisa Wade, PhD is an Associate Professor at Tulane University. She is the author of American Hookup, a book about college sexual culture; a textbook about gender; and a forthcoming introductory text: Terrible Magnificent Sociology. You can follow her on Twitter and Instagram.

One conventional explanation for our economic problems seems to be that our businesses are strapped for funds.  Greater business earnings, it is said, will translate into needed investment, employment, consumption and, finally, sustained economic recovery.  Thus, the preferred policy response: provide business with greater regulatory freedom and relief from high taxes and wages.

It is this view that underpins current business and government support for new corporate tax cuts and trade agreements designed to reduce government regulation of business activity, attacks on unions, and opposition to extending unemployment benefits and increasing the minimum wage.

One problem with this story is that businesses are already swimming in money and they haven’t shown the slightest inclination to use their funds for investment or employment.

The first chart below highlights the trend in free cash flow as a percentage of GDP.  Free cash flow is one way to represent business profits.  More specifically, it is a pretax measure of the money firms have after spending on wages and salaries, depreciation charges, amortization of past loans, and new investment.  As you can see that ratio remains at historic highs.  In short, business is certainly not short of money.

1 (2)

So what are businesses doing with their funds?  The next chart looks at the ratio of net private nonresidential fixed investment to net domestic product (I use “net” rather than “gross” variables in order to focus on investment that goes beyond simply replacing worn out plant and equipment).  The ratio makes clear that one reason for the large cash flow is that businesses are not committed to new investment.  Indeed quite the opposite is true.

1 (3)

Rather than invest in plant and equipment, businesses are primarily using their funds to repurchase their own stocks in order to boost management earnings and ward off hostile take-overs, pay dividends to stockholders, and accumulate large cash and bond holdings.

Cutting taxes, deregulation, attacking unions and slashing social programs will only intensify these very trends.  Time for a new understanding of our problems and a very new response to them.

Cross-posted at Reports from the Economic Front.

Martin Hart-Landsberg is a professor of economics at Lewis and Clark College. You can follow him at Reports from the Economic Front.