academia

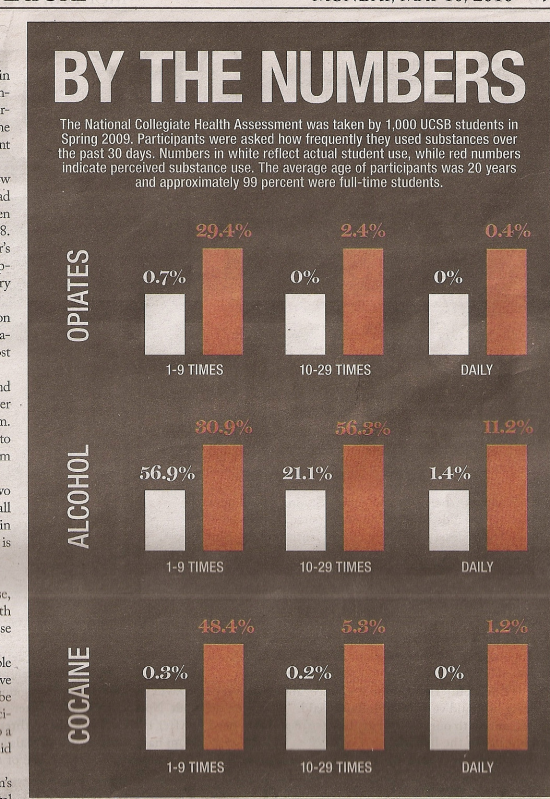
The phrase “pluralistic ignorance” refers to a situation where a large proportion of a population misunderstands reality.  They may all agree, but they are, nonetheless, mistaken.  This data on University of California-Santa Barbara students from the National Collegiate Health Assessment is a great illustration of this idea; it’s also a great illustration, however, of a terrible, terrible illustration.

Let’s get past the bad graphic first.  The white bars (which represent the percent of people reporting that they themselves used opiates, alcohol, or cocaine) are all the same height, despite the fact, for example, that 56.9% of students reported using alcohol 1-9 times in the last month, but only 0.3% reported using cocaine.  So the bars do not actually represent the percentages they are supposed to.  The red bars (which represent the percent of people that respondents think are using drugs and alcohol) suffer from the same problem.  In one case, the white bar should be even higher than the red bar.

But, if we can get past the poor graphic, then the information is really interesting.  In all but one case, the number of people reporting drug and alcohol use is smaller than the perceptions of how many people are using these substances.  For example, looking at the middle column, (almost) no one reports using opiates or cocaine 10-29 times last month, but students perceive  that 2.4% and 5.3% of the population (respectively) are; similarly, 21.1% of students report drinking alcohol 10-29 times last month, but they perceive that over half the population is drinking that frequently.

This pattern is consistently true in all cases except for the percentage of people who drank alcohol 1-9 times in the last month.  The majority of respondents who drink reported that they did so at that rate, but they perceive that others are drinking far more than they are.  The overall impact of the illustration, then, is correct.  On the whole, students perceive more drug and alcohol use than they report.

It’s possible that people are underreporting and their perceptions are more true than the self-reports.  If their self-reports are more true, however, than we have a case of pluralistic ignorance.  In this case, students agree that the rate of drug and alcohol use is higher than it actually is.  They may, then, feel pressure to drink and do drugs more frequently to fit in, even as doing so results in just the opposite.

Eager Eyes, via Flowing Data.

—————————

Lisa Wade is a professor of sociology at Occidental College. You can follow her on Twitter and Facebook.

PART ONE:

Drinking lowers your GPA. So do smoking, spending time on the computer, and probably other forms of moral dissolution. That’s the conclusion of a survey of 10,000 students in Minnesota.

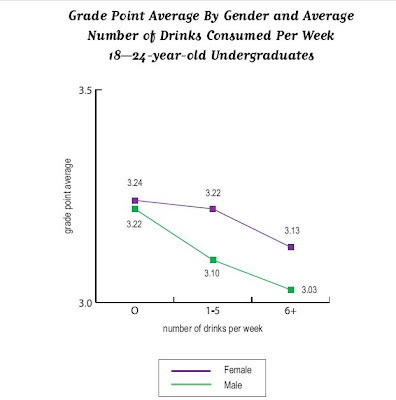
Inside Higher Ed reported it, as did the Minnesota press with titles like “Bad Habits = Bad Grades.” Chris Uggen reprints graphs of some of the “more dramatic results” (that’s the report’s phrase, not Chris’s). Here’s a graph of the effects of the demon rum.

Pretty impressive . . . if you don’t look too closely. But note: the range of the y-axis is from 3.0 to 3.5.

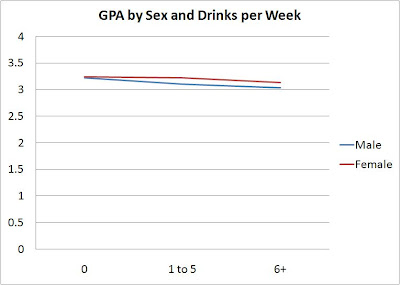
I’ve blogged before about “gee whiz” graphs , and I guess I’ll keep doing so as long as people keep using them. Here are the same numbers, but the graph below scales them on the traditional GPA scale of 0 to 4.0.

The difference is real – the teetotalers have a B+ average, heaviest drinkers a B. But is it dramatic?

I also would like finer distinctions in the independent variable, but maybe that’s because my glass of wine with dinner each night, six or seven a week, puts me in the top category with the big boozers. I suspect that the big differences are not between the one-drink-a-day students and the teetotalers but between the really heavy drinkers – the ones who have six drinks or more in a sitting, not in a week– and everyone else.

—————————-

PART TWO:

Some time ago, the comments on a post here brought up the topic of the “gee whiz graph.” Recently, thanks to a lead from Andrew Gelman, I’ve found another good example in a recent paper.

The authors, Leif Nelson and Joseph Simmons, have been looking at the influence of initials. Their ideas seem silly at first glance (batters whose names begin with K are more likely to strike out), like those other name studies that claim people named Dennis are more likely to become dentists while those named Lawrence or Laura are more likely to become lawyers

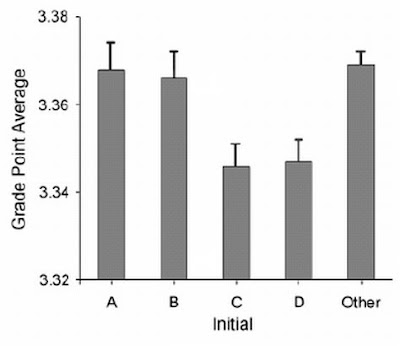
But Nelson and Simmons have the data. Here’s their graph showing that students whose last names begin with C and D get lower grades than do students whose names begin with A and B.

The graph shows an impressive difference, certainly one that warrants Nelson and Simmon’s explanation:

Despite the pervasive desire to achieve high grades, students with the initial C or D, presumably because of a fondness for these letters, were slightly less successful at achieving their conscious academic goals than were students with other initials.

Notice that “slightly.” To find out how slight, you have to take a second look at the numbers on the axis of that gee-whiz graph. The Nelson-Simmons paper doesn’t give the actual means, but from the graph it looks as though he A students’ mean is not quite 3.37. The D students average between 3.34 and 3.35, closer to the latter. But even if the means were, respectively, 3.37 and 3.34, that’s a difference of a whopping 0.03 GPA points.

When you put the numbers on a GPA axis that goes from 0 to 4.0, the differences look like this.

According to Nelson and Simmons, the AB / CD difference was significant (F = 4.55, p < .001). But as I remind students, in the language of statistics, a significant difference is not the same as a meaningful difference.

One of the criticisms sociologists sometimes have of economics is related to the assumption of rational choice. Many economic models assume that individuals will always act to maximize their benefit.

Sociology, however, is premised on the idea that humans make meaning. To begin with, what is “rational” is socially constructed and, further, humans value many things beyond pure strategic economic gain.

The photo below illustrates this concept quite well:

If you had a found iPod touch, which number would you call? Certainly some of you might call for the $51 reward, but many of us would call for the $50 reward. We would sacrifice that extra dollar because we would know that the second person is scamming, while the first is (probably) honest.

The proportion of people that would call the scammer, of course, goes up as his reward gets increasingly large compared to the original reward. But this doesn’t mean that rational choice theory is correct, it just means that we’re rational. That is, many of us are more willing to do the less-right thing when there is more to gain from it (though our tipping points are going to vary tremendously). Pure rational choice theory, though, would have us calling the scammer every time, even if only for a buck, as if nothing else matters.

The High Definite, via MontClair SocioBlog (where Jay first spoke to rational choice theory in his post).

Lisa Wade, PhD is an Associate Professor at Tulane University. She is the author of American Hookup, a book about college sexual culture; a textbook about gender; and a forthcoming introductory text: Terrible Magnificent Sociology. You can follow her on Twitter and Instagram.

Yes, but not, perhaps, as non-religious as you might think.

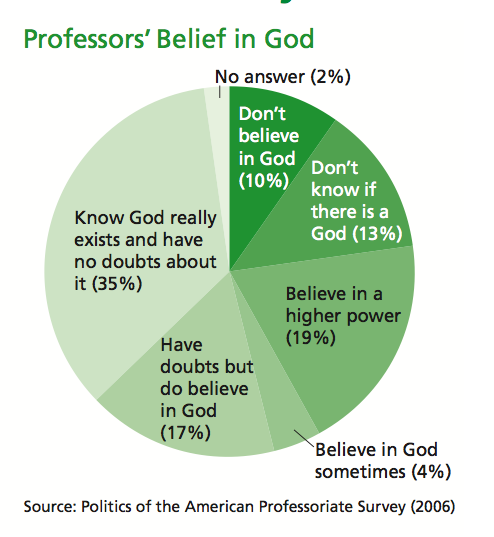
A study just published in Sociology of Religion, by Neil Gross and Solon Simmons, reported that about 3/4ths of professors report some belief in God or a higher power.  About 35% of professors are absolutely certain that God exists, while 21% believe, but are not absolutely sure.

Only 10% of professors are athiests and another 13 percent are agnostic.

So, is 23 percent many or only a few non-believers?

On the one hand, it may seem like very few if you consider that the professoriate is routinely characterized as radically liberal and anti-religious.  As Shannon Golden at Contexts Crawler says:

Devout parents often worry about the “secularizing” effects of sending their children off to college. They envision professors pushing secular thoughts and anti-religious values on their impressionable students.

Despite the stereotype, this data suggests that the majority of professors would welcome religious belief in their classrooms.

On the other hand, it may seem like a lot of athiests and agnostics if you compare the numbers to the general U.S. population.  According to the Pew Forum on Religious and Public Life, only 4% of the U.S. population is athiest or agnostic (see the data waaaay down at the bottom there):

From this perspective, 23% is a lot.

So what do you think?  Are you surprised by how few professors report being athiests or agnostics?  Or are you surprised by how many?

Lisa Wade, PhD is an Associate Professor at Tulane University. She is the author of American Hookup, a book about college sexual culture; a textbook about gender; and a forthcoming introductory text: Terrible Magnificent Sociology. You can follow her on Twitter and Instagram.

Crossposted at Jezebel.

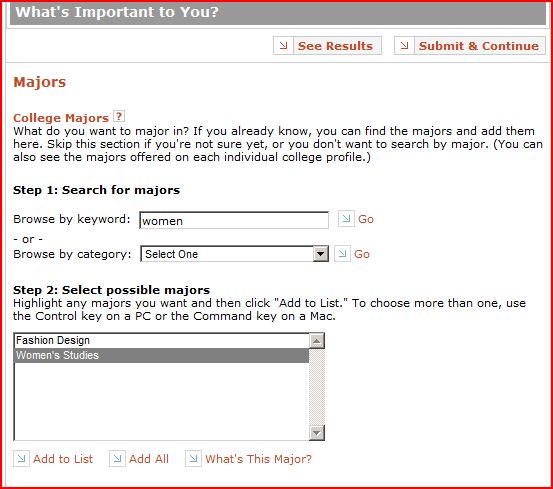
Ajax was searching for majors on College Board, a website aimed at helping people get into and through college.  She wanted to search for colleges with women’s studies majors and when she typed “women” into the keyword field, the search function returned two majors: women’s studies and fashion design.

This would make perfect sense if the search function returned only women’s studies since it has “women” in the name and all.  But fashion design?  It suggests that somehow fashion design has been marked as a major-for- or about-women, but no other major has.

What about, say, history?  Nope, no women in that.
Psychology?  Well, there is a Psych of Women class.  But, otherwise no.
Economics?  Don’t make me laugh!
Queer Studies? Afro-Am? Wait? Women are gay!? And black!?
Politics?  Oh honey, don’t worry your pretty little head about it!
Literature?  Oh yeah!  We forgot literature!   Let’s slap a “women” tag on that one and call it a day.

UPDATE: Brenden L. went to the website and typed in men. Guess what he got?

Lisa Wade, PhD is an Associate Professor at Tulane University. She is the author of American Hookup, a book about college sexual culture; a textbook about gender; and a forthcoming introductory text: Terrible Magnificent Sociology. You can follow her on Twitter and Instagram.

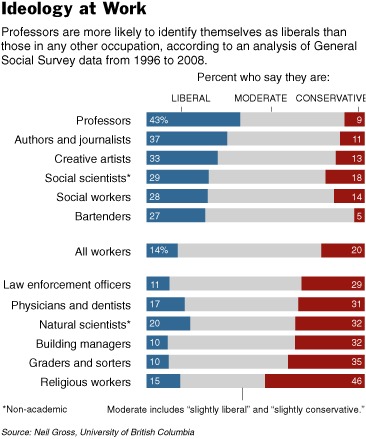
The stereotype that professors are more likely to be liberal than people in other occupations was confirmed by a recent study by sociologists Neil Gross and Ethan Fosse:

The study measured a number of reasons why college professors may be more liberal.  Among others, they argued that already liberal people may be drawn to academia because they perceive that academics are liberal.  That is, just as women are drawn to teaching and men to construction work because these jobs are gendered, academia is a politically-typed job that draws people who identify as liberal already.

They also speculate that the relative low pay, given the high educational attainment that the profession requires and high status that it brings, may lead professors to lean towards democratic principles of economic redistribution.  They write:

Deprived of economic success relative to those in the world of commerce, intellectuals are less likely to be invested in preserving the socioeconomic order, may turn toward redistributionist policies in hopes of reducing perceived status inconsistency, and may embrace unconventional social or political views in order to distinguish themselves culturally from the business classes (quoted here).

I think this is a fascinating and provocative question, even given Gross and Fosse’s excellent work, and one that I’ve wondered about many times.  Thoughts?

Lisa Wade, PhD is an Associate Professor at Tulane University. She is the author of American Hookup, a book about college sexual culture; a textbook about gender; and a forthcoming introductory text: Terrible Magnificent Sociology. You can follow her on Twitter and Instagram.

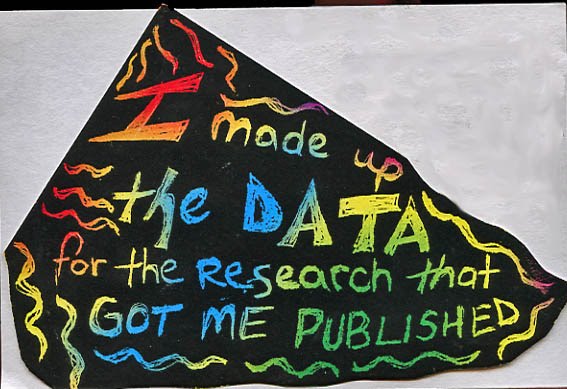
An anonymous confession sent to PostSecret, a site for secrets:

See also our post on the plagiarized dissertation of then-Jacksonville State University president, William Meehan.

Lisa Wade, PhD is an Associate Professor at Tulane University. She is the author of American Hookup, a book about college sexual culture; a textbook about gender; and a forthcoming introductory text: Terrible Magnificent Sociology. You can follow her on Twitter and Instagram.

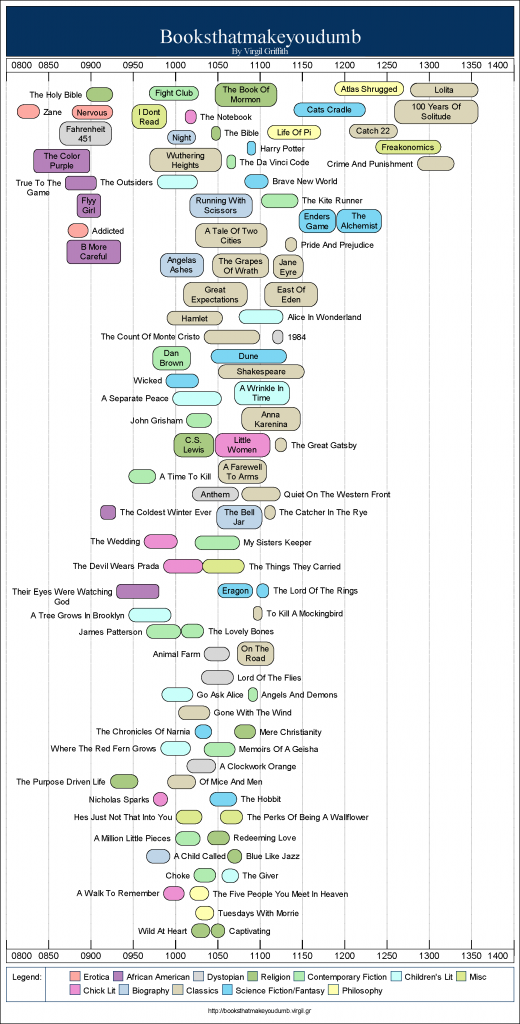
Nanette D. informed us about the site Books that Make You Dumb, which uses a questionable methodology to correlate SAT scores at various colleges and universities with the books Facebook users from those schools list as their favorites, taking the 10 most popular from each school (there’s an explanation of the methodology at the website; the width of the bubble the names are in indicate the standard deviation in SAT scores). By seeing which books are listed by people at schools with higher overall SATs, we supposedly find out which books make people smarter or dumber:

booksthatmakeyoudumblarge

So Their Eyes Were Watching God, by the fabulous Zora Neale Hurston, makes you dumber than Gone with the Wind or A Million Little Pieces? Really?

Nanette says,

I think it reinforces a lot of ugly stereotypes about what type of person reads what type of literature, and the inherent “quality” of particular genres.

It’s a good point. There’s something interesting about designating certain types of books as “genre fiction,” which seems to be kind of a negative label, in general. Isn’t all literature technically part of a genre?

It’s all very Bourdieuian, really. To a great extent, what we read is a reflection of our class and our class is the number one predictor of our SAT score. So what is being measured (if anything) the way that class determines both our “taste” in literature and (or by way of) our educational achievements.

Aside from those issues, you could definitely have some fun talking about meaningless statistics and methodological issues with this graph. Just because you can find some statistics to correlate doesn’t mean they’re actually useful.

[Note: For the record, yes, I get it that the author was being kind of silly, and that he didn’t make up the genre classifications. The reason I find it interesting is that I think it reflects to some degree what a lot of people think–that certain types of books are inherently indicators of bad taste. I have friends who read fantasy and science fiction and get annoyed that it’s considered “genre fiction,” which they feel carries a negative connotation. Black authors have similarly complained about their books automatically going into the “African American literature” section at some bookstores rather than the mainstream “regular” fiction section. So mostly the image was a jumping off point for me thinking about how we often judge people by the types of books they read. And believe me, I’m not immune to this. When a relative gave me a set of three romance novels for Christmas a couple of years ago because I “like books,” I was perplexed. Though part of my confusion came from the fact that they were romance novels set among the Amish, and the concept of Amish romance novels had never in my life occurred to me. And then it turned out the relative didn’t know what they were; she had looked at the cover, saw a woman in the bonnet, and thought they were Little House on the Prairie books, which then left me with the question of why you would buy the Little House books for a 33 year old. But, you know, the thought that counts, etc. etc.]