Cross-posted at AlterNetJezebel, and VitaminW.

I don’t know about you, but whenever I go shopping for shoes, I’m always stunned by the incredible disproportion of high heels.  I’m just gonna guestimate here, but I’ll bet 85% of the shoes at the average store are high heels so impractical that most women only wear them on special occasions that involve a lot of sitting down.  These shoes, moreover, seem to be pushed to the front of the display.  Women’s shoe stores beckon shoppers by putting their most outrageous shoes out front.  You have to go digging for a practical pump. A quick Google image search for “women’s shoes” reveals the same bias in favor of the four-inch or higher, spindly heeled shoe:

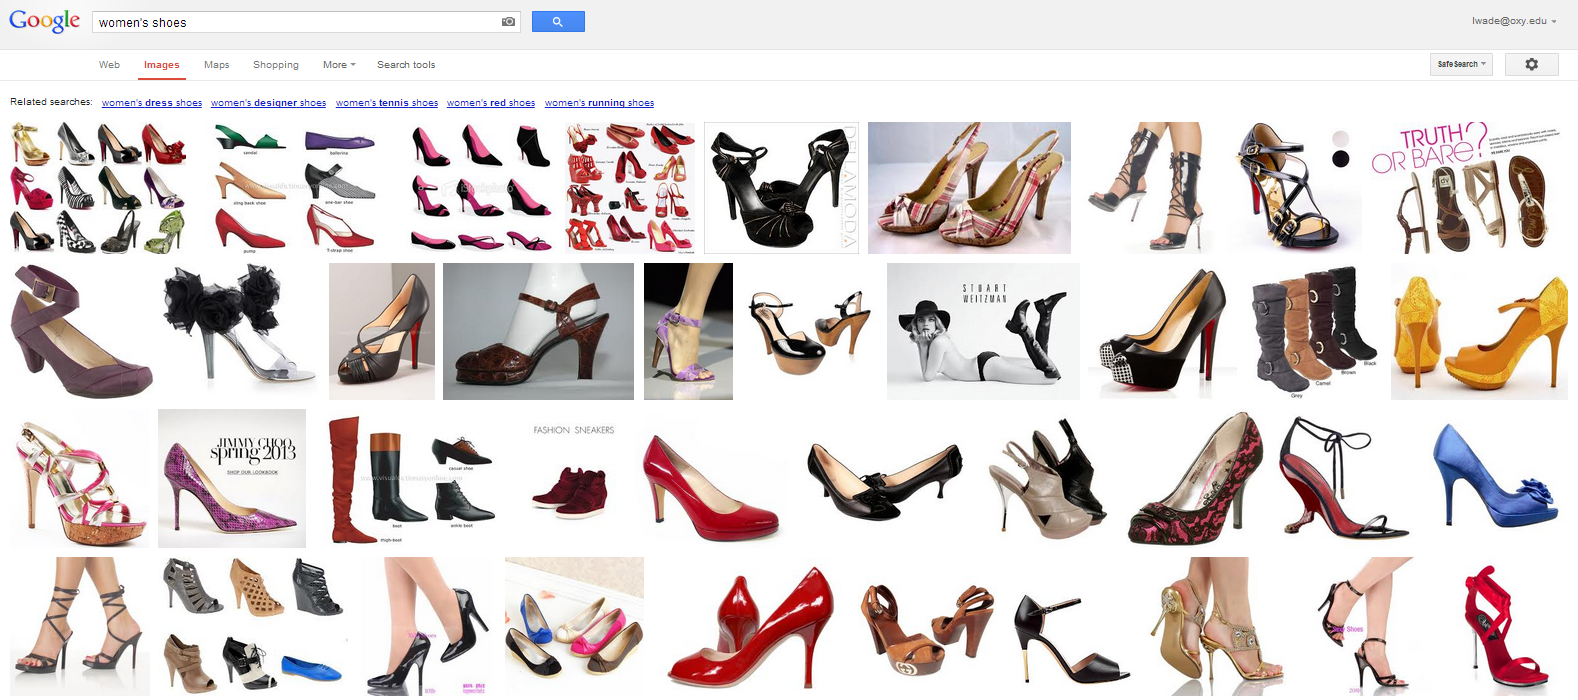
How is it that a shoe that gets 1% of feet time takes up 85% of retail space?  I’m gonna take a shot at offering an answer.

In a previous post I reviewed the history of the high heel.  Originally a shoe for high-status men, it was adopted by the lower classes.  Elites responded by heightening the heel.  The higher the heel, the more impractical the shoe.  Eventually the working classes couldn’t keep up with the escalation because they had to, you know, work.  Sociologically, this is an example of what Pierre Bourdieu famously called “distinction.”  The rich work to preserve certain cultural arenas and products for themselves.  This allows them to signify their status; you know, keep them from getting confused with the masses.

I think something similar is going on today among women. Certain class advantages make it easier for upper middle class and wealthy women to don high heels.  High heels can really only be worn routinely by women who don’t work on their feet all day (I’ll grant there are dedicated exceptions).  Valet parking makes it a whole lot easier to wear shoes that hurt to walk in, so does not having to take the bus.* Having money, in itself, means that nothing stands between you and buying things that are impractical. So, high heels function to differentiate women who can afford to be impractical with their footwear — both monetarily and in practice — from women who can’t. This, I think, is why the highest, spikiest heels are are the front of the shoe store.  In a certain way, they signify status.  Wearing those shoes promises to differentiate you from other “lesser” women, women who can’t invest in their appearance and get lots of practice looking elegant on their tip toes.

Women of all classes desire such shoes because of the signals they send and they often buy them aspirationally, hoping to be the type of woman who wears them.  It’s primarily women at the top of the class hierarchy that will be able wear them routinely, though, feeding the supply of barely worn spike heels that populate every thrift store in America. So, that’s my theory.

But let’s complicate it just a bit more.  Since working class people do, ultimately, have access to high-heeled shoes, the upper classes have to go to extra lengths to effectively use high heels as a marker of distinction.  This can be accomplished by sub-dividing high heels into “classy” and “trashy”: 
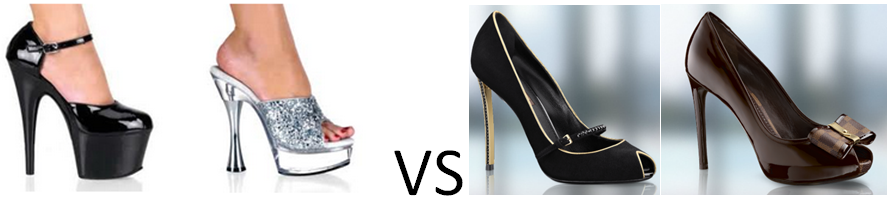
I got the ones on the left by Googling “stripper shoes” and the ones on the right are courtesy of Louis Vuitton, $890 and $1,450 respectively. Now I know that you can get “classy” heels for much cheaper, but the point is to identify this as an arms race.  The rich have the power to control the discourse and can always access the high-status objects.  The poor can copy, but they are often playing catch up because the rich are always changing the rules.  So, as soon as the poor are doing it right, the rules change, otherwise the activity doesn’t function to distinguish the rich from the poor.  And so on.

* Men, if you’re reading, high heels really do hurt to walk in.  Yes, pretty much all the time.  Most women are used to it and mild pain may not even register consciously.  Sometimes the pain is quite significant, but women wear them anyway.  You’ve probably seen women in your life kicking off their high heels as soon as they walk in the door, or rubbing their feet and wincing; there’s a reason for that.

Lisa Wade, PhD is an Associate Professor at Tulane University. She is the author of American Hookup, a book about college sexual culture; a textbook about gender; and a forthcoming introductory text: Terrible Magnificent Sociology. You can follow her on Twitter and Instagram.

Screenshot_1In this charming minute-and-a-half, Walter Cronkite demos the home office of 2001, as envisioned in 1967.  Amazingly, reality seems to have far outpaced their imagination!

I love the first line, by the way: “This is where a man might spend most of his time in the home of the 21st century.”  Apparently professional futurists in 1967 couldn’t imagine women working!

Via Cyborgology.

Lisa Wade, PhD is an Associate Professor at Tulane University. She is the author of American Hookup, a book about college sexual culture; a textbook about gender; and a forthcoming introductory text: Terrible Magnificent Sociology. You can follow her on Twitter and Instagram.

Screenshot_15Naama Nagar tweeted us an interesting video commentary about hipsters.  In it, Mike Rugnetta uses Pierre Bourdieu’s idea of cultural capital to describe the difference between nerds and hipsters.

This is a topic I’ve enjoyed thinking about myself (on CNN and here at SocImages).  I think Rugnetta makes an interesting argument that resonates with the observations of sociologists: being a hipster is about borrowing other people’s authentic cultural signifiers as their main or only consistent cultural practice.  Check it out:

Lisa Wade, PhD is an Associate Professor at Tulane University. She is the author of American Hookup, a book about college sexual culture; a textbook about gender; and a forthcoming introductory text: Terrible Magnificent Sociology. You can follow her on Twitter and Instagram.

This week Neil DeGrasse Tyson tweeted the following, along with a photograph of suspiciously gendered AP exam study guide covers:

1

I’m going to take this to mean that Tyson is as big a fan of sociology as I am of astrophysics.  Made my day.

Thanks to Jay Livingston for the tip!

Lisa Wade, PhD is an Associate Professor at Tulane University. She is the author of American Hookup, a book about college sexual culture; a textbook about gender; and a forthcoming introductory text: Terrible Magnificent Sociology. You can follow her on Twitter and Instagram.

The  International Society of Aesthetic Plastic Surgeons has released new data on the incidence of invasive and non-invasive cosmetic procedures.  The U.S. leads in sheer numbers of procedures but, accounting for population, we fall into 4th place.  South Korea leads for the number of procedures per person, followed by Greece and Italy.

1

By far the most common kinds of surgical cosmetic procedures are lipoplasty and breast augmentation.  Along with fat, breasts seem to be a particular concern: breast lifts and breast reductions for both men and women are also in the top ten.  Abdominoplasty, nose jobs, eyelid surgeries, and facelifts are as well.

2

The incidence of these surgeries is strongly related to everything from the gender binary to global power dynamics.  In 2008 we reported that male breast reductions were the most common cosmetic surgery for 13-19 year olds (boys and girls combined). You would be shocked at what counts as excess breast tissue and how little the before and after photos look.  Boys and men getting breast reductions, alongside women getting augmentations, is obviously about our desire for men and women to be different, not naturally-occurring difference.  See The Story of My Man-Boobs for more.

Likewise, we’ve posted about surgeries that create an epithelial fold, a fold of skin in the eyelid more common in people with White than Asian ethnic backgrounds.  This surgery is a trend among Asians and Asian-Americans, as colonization has left us with an association between Whiteness, attractiveness, and power.

The Economist summarizes some other trends:

Breast augmentation, the second biggest surgical procedure, is most commonly performed in America and Brazil. Buttock implants are also a Brazilian specialty, as is vaginal rejuvenation. Asia is keen on nose jobs: China, Japan and South Korea are among the top five nations for rhinoplasty.

More on where and how many procedures are being performed, but nothing on why, at the ISAPS report.

Image at The Economist; via Global Sociology.

Lisa Wade, PhD is an Associate Professor at Tulane University. She is the author of American Hookup, a book about college sexual culture; a textbook about gender; and a forthcoming introductory text: Terrible Magnificent Sociology. You can follow her on Twitter and Instagram.

How many Americans think about the war in Afghanistan regularly? The daily realities of war are inescapable for military members and their families, but the rest are largely able to stay disconnected from it. The issues of foreign policy and war dropped off the radar entirely for most Americans before the 2012 election.

About 68,000 U.S. troops are still deployed in Afghanistan, down from the peak of 101,000 (not to mention the those who were in Iraq). Without a draft, WWII-style war bond campaigns, or highly visible war industry, most Americans need to be reminded that we’re at war.  Unlike veterans and military families, civilians not directly connected to the military have a kind of privilege to forget the conflict in their daily lives. The result is a growing chasm between U.S. civilians and the Armed Forces.

In 2011, the Pew Research Center surveyed Americans about their connections to the military and found a considerable gap: “Never has the U.S. public been so separate, so removed, so isolated from the people it pays to protect it.” The vast majority of those over 50 had an immediate family member who had served (mostly due to WWII and Vietnam). Of those 30-49 years old, 57%  had someone in their immediate family serve. Those between 18-29 are the most disconnected from war; only 33% have a close family member with military experience:

2011-family-connections-01

picture2

This leads to differences in views about the military. Those from military families are more likely to believe that civilians do not understand what they go through, that the U.S. “is the greatest country in the world,” and that they are “more patriotic than most people in the country.” They’re also more likely to recommend the armed forces to a young person — though only about half would do so:

picture3

My own research on the experiences of military families during deployment supports the Pew findings. And patterns in who joins the armed forces may lead to an increased gap. Those with veterans in their family are more likely to join the military; 79% of young veterans, compared to 61% of the public, have family members who served. As fewer Americans have relatives who were in the military, making them less likely to join themselves, insulation from the military grows.

This bumper sticker reflects this gap between military families and everyone else. It draws a distinction between “my” service member and “your” freedom, while seeming to assume a lack of support from non-military Americans:

bumper sticker

Military families believe that others don’t understand what they go through during deployment. As one mother told me, “We understand why we try to be strong but automatically cry when we see the foot powder display at Wal-Mart.” Or as an Iraq war veteran explained to Time,

The gap between the military and everybody else is getting worse because people don’t know–and don’t want to know–what you’ve been through…There are no bond drives. There are no tax hikes. There are no food drives or rubber drives … It’s hard not to think of my war as a bizarre camping trip that no one else went on.

Veterans return to a country where very few understand what they have been through, which makes reentry into civilian life more difficult — just one of the consequences of having a small segment of the country assume the burdens of war.

——————–

Wendy Christensen is an Assistant Professor at William Paterson University whose specialty includes the intersection of gender, war, and the media.

Screenshot_5One of the few genuinely large observed differences between men and women involves throwing ability.  Men, on average, are much stronger throwers than women.  Hence the phrase “throws like a girl.”

That we observe a difference, however, tells us nothing about where that difference comes from.  Figuring that out is much more difficult than simply measuring difference and sameness.  We know that the difference emerges at puberty, suggesting that sheer size might have something to do with it.  But the fact that boys and men, on average, get much more practice throwing than women might also play a role.  How to test this?

Well, here’s one way: compare men and women throwing with their non-dominant hand.  Muscle memory doesn’t transfer from one side of the body to the other.  Accordingly, since most people have a lot of practice throwing only with one hand, comparing the throws of men and women using their non-dominant hand might tell us something interesting.

I don’t know that that study has been done, but an enterprising videographer has captured video of a set of men throwing with the “wrong” hand. What I like most about the video is the men’s facial expressions.  You can see them laughing at themselves, suddenly reduced to a beginner thrower.  Though we still don’t know how much of it is biological and how much social — though, this is the wrong question anyway — it reveals that, no matter what the answer, men’s throwing ability is strongly related to practice:

A big thanks to Reynaldo C. for sending in the video!

Cross-posted at BlogHer.

Lisa Wade, PhD is an Associate Professor at Tulane University. She is the author of American Hookup, a book about college sexual culture; a textbook about gender; and a forthcoming introductory text: Terrible Magnificent Sociology. You can follow her on Twitter and Instagram.

Cross-posted at Racialicious and Family Inequality.

Trying to summarize a few historical trends for the last half century, I thought of framing them in terms of diversity.

Diversity is often an unsatisfying concept, used to describe hierarchical inequality as mere difference. But inequality is a form of diversity — a kind of difference. And further, not all social diversity is inequality. When people belong to categories and the categories are not ranked hierarchically (or you’re not interested in the ranking for whatever reason), the concept of diversity is useful.

There are various ways of constructing a diversity index, but I use the one sometimes called the Blau index, which is easy to calculate and has a nice interpretation: the probability that two randomly selected individuals are from different groups.

Example: Religion

Take religion. According to the 2001 census of India, this was the religious breakdown of the population:

1.jpg

Diversity is calculated by summing the squares of the proportions in each category, and subtracting the sum from 1. So in India in 2001, if you picked two people at random, you had a 1/3 chance of getting people with different religions (as measured by the census).

Is .33 a lot of religious diversity? Not really, it turns out. I was surprised to read on the cover of this book by a Harvard professor that the United States is “the world’s most religiously diverse nation.” When I flipped through the book, though, I was disappointed to see it doesn’t actually talk much about other countries, and does not seem to offer the systematic comparison necessary to make such a claim.

With our diversity index, it’s not hard to compare religious diversity across 52 countries using data from World Values Survey, with this result:

2

The U.S. is quite diverse — .66 — but a number of countries rank higher.


Increasing U.S. Diversity

Anyway, back to describing the last half century in the U.S. On four important measures I’ve got easy-to-identify increasing diversity:

3

5

4

6

The last one is a little tricky. It’s common to report that the median age at marriage has increased since the 1950s (having fallen before the 1950s). But I realized it’s not just the average increasing, but the dispersion: More people marrying at different ages. So the experience of marriage is not just shifting rightward on the age distribution, but spreading out. Here’s another view of the same data:

7

I calculated these using the Panel Study of Income Dynamics from 1968 (for those married in the years 1950-1968) and comparing it with the 2011 American Community Survey for those married in the previous year. There might be a better way, of course.

I have complained before that using the 1950s or thereabouts as a benchmark is misleading because it was an unusual period, marked by high conformity, especially with regard to family matters. But it is still the case that since then diversity on a number of important measures has increased. Over the period of several generations, in important ways the people we randomly encounter are more likely to be different from ourselves (and each other).

Philip N. Cohen is a professor of sociology at the University of Maryland, College Park, and writes the blog Family Inequality. You can follow him on Twitter or Facebook.