I’m not saying that the Patriots are out-and-out liars. But they are outliers.

The advantage of an underinflated ball, like the eleven of the twelve footballs the Patriots used last Sunday, is that it’s easier to grip. Ball carriers will be less likely fumble if they’re gripping a ball they can sink their fingers into.

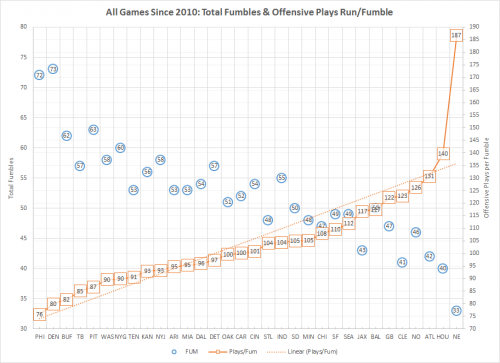
We can’t go back and measure the pressure of balls the Patriots were using before the Colts game, but Warren Sharp (here) went back and dug up the data on fumbles for all NFL games since 2010.  Since a team that controls the ball and runs more plays has more chances to fumble, Sharp graphed the ratio of plays to fumbles (values in red squares in the chart below) along with the absolute number of fumbles (values in blue circles). The higher the ratio, the less fumble-prone the team was.

1

One of these things is not like the others.  That’s what an outlier is. It’s off the charts. It’s nowhere near the trend line. Something about it is very different. The variables that might explain the differences among the other data points – better players, better weather or a domed stadium, a pass-centered offense – don’t apply. Something else is going on.

As the graph shows, when the teams are rank ordered on the plays/fumbles ratio, the difference between one team and the next higher is usually 0-2, there are only two gaps of 5 until the 9-point gap between #3 Atlanta and #2 Houston. From the second-best Texans and to the Patriots there’s a 47-point jump.

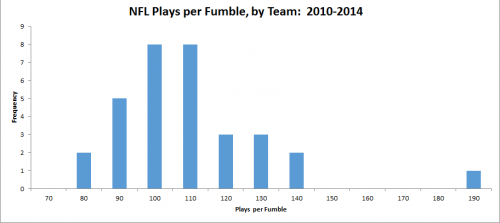
Sharp also graphed the data as a histogram.

1 (4)

It’s pretty much a bell curve centered around the mean of 105 plays-per-fumble. Except for that outlier. And the chart shows just how far out it lies.

The Patriots play in a cold-weather climate in a stadium exposed to the elements.  Yet their plays/fumble ratio is 50% higher than that of the Packers, 80% higher than the Bears. They have good players, but those players fumble less often for the Patriots than they did when they played for other NFL teams.

Usually, the statistical anomaly comes first – someone notices that US healthcare costs are double those of other nations – and then people try to come up with explanations.  In this case, it wasn’t until we had a possible explanatory variable that researchers went back and found the outlier. As Peter Sagal of “Wait, Wait, Don’t Tell Me” said, “The League became suspicious when a Patriots player scored a touchdown and instead of spiking the ball he just folded it and put it in his pocket.”

UPDATE, Jan. 28: Since I posted this, there has been some discussion of Sharp’s data (“discussion” is a euphemism – this is sports and the Internet after all). If you’re really interested in pursuing this, try Advanced Football Analytics  or this piece  at Deadspin “Why Those Statistics About The Patriots’ Fumbles Are Mostly Junk,” (to repeat, “discussion” is a euphemism, and if you more strongly voiced views, read the comments). One of the difficulties I suspect is that a fumble is a rare event. The difference between the teams with the surest grip and the most butterfingered is about one fumble every couple of games.

Cross-posted at Montclair SocioBlog.

Jay Livingston is the chair of the Sociology Department at Montclair State University. You can follow him at Montclair SocioBlog or on Twitter.

I wrote this for The Conversation. Read the original here.

Observers may be quick to declare social trends “good” or “bad” for families, but such conclusions are rarely justified. What’s good for one family – or group of families – may be bad for another. And within families, interests do not always align. Divorce is “bad” for a family in the sense of breaking it apart, but it may be beneficial, or even essential, for one or both partners or their children.

This kind of ambiguity makes it difficult to assess what kind of impact the recent recession and its aftermath had on families. But for researchers, at least, it offers a lot of job security – so many questions, so much going on. In any case, here’s where we stand so far.

The effect of the Great Recession on family trends in the United States has been dramatic with regard to birth rates and divorce, and has been strongly suggestive of family violence, but less clear for marriage and cohabitation.

Marriage rates declined, and cohabitation rates increased, but these trends were already underway, and the recession didn’t alter them much. When trends don’t change direction it’s difficult to identify an effect of a shock this broad. However, with both birth rates and divorce, clear patterns emerged.

Birth rates: a sharp drop

The most dramatic impact was on birth rates, which dropped precipitously, especially for young women, as a result of the economic crisis. How do we know? First, the timing of the fertility decline is very suggestive. After increasing steadily from the beginning of 2002 until late 2007, birth rates dropped sharply. (The decline has since slowed for some groups after 2010, but the U.S. still saw record-low birth rates for teenagers and women ages 20-24 as late as 2012.)

Second, the decline in fertility was steeper in states with greater increases in unemployment. Although we don’t have the data to determine which couple did or did not have a child in response to economic changes, this pattern supports the idea that financial concerns convinced some people to not have a child.

That interpretation is supported by the third trend: the fertility drop was more pronounced among younger women – and there was no drop at all among women over 40. That may mean the fertility decline represents births postponed by families that intend to have children later – an option older women may not have – which fits previous research on economic shocks.

It seems likely that people who are on the fence about having a baby can be swayed by perceived financial hardship or uncertainty. From research on 27 European countries, we know that people with troubled family financial situations are more likely to say they are unsure whether they will meet their stated childbearing goals – that is, economic uncertainty doesn’t change their familial aims but may increase uncertainty in whether they will be met.

However, some births delayed inevitably become births foregone. Based on the effect of unemployment on birth rates in earlier periods, it appears a substantial number of young women who postponed births will end up never having children. By one estimate, women who were in their early 20s during the Great Recession are projected to have some 400,000 fewer lifetime births and an additional 1.5% of them will never have a birth.

Divorce rates: a counter-intuitive reaction

In the case of divorce, the pattern is counter-intuitive. Although economic hardship and insecurity adds stress to relationships and increases the risk of divorce, the overall divorce rate usually drops when unemployment rates rise.

Researchers believe that, like births, people postpone divorces during economic crises because of the costs of divorcing – not just legal fees, but also housing transitions (which were especially difficult in the Great Recession) and employment disruptions.

My own research found that there was a sharp drop in the divorce rate in 2009 that can reasonably be attributed to the recession. But, as we suspect will be the case with births, there appears to have been a divorce-rate rebound in the years that followed.

Domestic violence: a spike along with joblessness

Family violence has become much less common since the 1990s. The reasons are not entirely clear, but they certainly include the overall drop in violent crime, improved response from social service and non-governmental organizations, and improvements in women’s relative economic status. However, when the recession hit there was a spike in intimate-partner violence, coinciding with the sharp rise in men’s unemployment rates (I show the trends here).

As with the other trends, it’s hard to make a case based on timing alone, but the evidence is fairly strong that the economic shock increased family stress and violence. For example, one study showed that mothers were more likely to report spanking their children in the months when consumer confidence fell. Another study found a jump in abusive head trauma cases during the recession in several regions. And there have been many anecdotal and journalist accounts of increases in family violence, emerging as early as 2009. Are these direct results of the economic stress or mere correlation? It’s hard to say for sure.

The ultimate impact of these trends on American families will likely take years to emerge. The recession may have affected the pattern of marriage in ways we don’t yet understand – how couples selected each other, who got married and who didn’t – and may create measurable group of marriages that are marked for future effects as yet unforeseen. Like the young adults who entered the labor market during the period of high unemployment and whose career trajectories will be forever altered unfavorably, how these families bear the scars cannot be predicted. Time will tell.

Philip N. Cohen is a professor of sociology at the University of Maryland, College Park. He writes the blog Family Inequality and is the author of The Family: Diversity, Inequality, and Social Change. You can follow him on Twitter or Facebook.
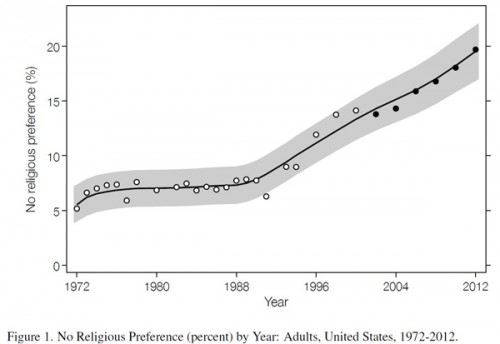
Over the past 40 years, Americans have become increasingly likely to deny an affiliation with a religion. The graph below shows that people with “no religious preference” rose from about 5% of the population in 1972 to about 20% today. Overall, however, Americans do not report a corresponding decline in the a belief in God, life after death, or other religious ideas. What’s going on?

2

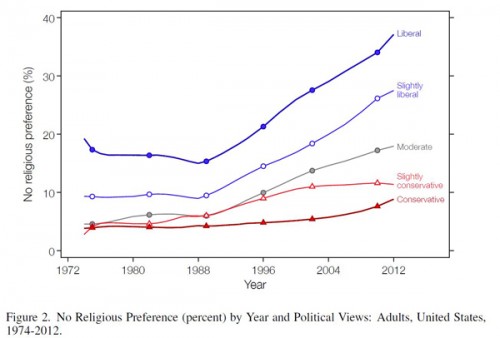
Sociologists Michael Hout and Claude Fischer — the guys who made the graph above — argue that the retreat from religious affiliation is essentially, a retreat from the political right. Religion has become strongly associated with conservative politics, so left-leaning people are choosing, instead, to identify as “spiritual but not religious.”

Here is some of their evidence. The data below represents the likelihood of rejecting a religious affiliation according to one’s political views. The more politically liberal one is, the more likely they have come to reject religion.

3

Using fancy statistical analyses, they explain: “generational differences in belief add nothing to explaining the cohort differences in affiliation.” That is, people haven’t lost their faith, they just disagree with religious leaders and institutions.  Hout and Fischer conclude:

Once the American public began connecting organized religion to the conservative political agenda — a connection that Republican politicians, abortion activists, and religious leaders all encouraged — many political liberals and moderates who seldom or never attended services quit expressing a religious preference when survey interviewers asked about it.

Democrats have wondered how to break the association of the right with religion and claim a little bit of moral authority for themselves. It looks like they may not need to or, even, that having failed to do so has a surprise advantage.

Lisa Wade, PhD is an Associate Professor at Tulane University. She is the author of American Hookup, a book about college sexual culture; a textbook about gender; and a forthcoming introductory text: Terrible Magnificent Sociology. You can follow her on Twitter and Instagram.

Every year, at the first faculty meeting, representatives of the registrar tell us what percentage of the incoming class is [insert variable in which we are interested, such as American Indian, working class, international, etc].  They compare it to last year’s percentage.  This drives me crazy because they do so as if comparing the last two data points in a sequence is indicative of a trend. But to determine whether or not there is a trend, and therefore whether the increase or decrease in the percentage of [insert variable in which we are interested] significant relative to last year, depends on more than two data points!

xkcd does an excellent job of illustrating just how two data points can be utterly meaningless, even wildly fallacious.

Other great xkcd cartoons: attribution and the in group, on statistical significance, correlation or causation, and the minimal group paradigm.

Originally posted in 2009.

Lisa Wade, PhD is an Associate Professor at Tulane University. She is the author of American Hookup, a book about college sexual culture; a textbook about gender; and a forthcoming introductory text: Terrible Magnificent Sociology. You can follow her on Twitter and Instagram.

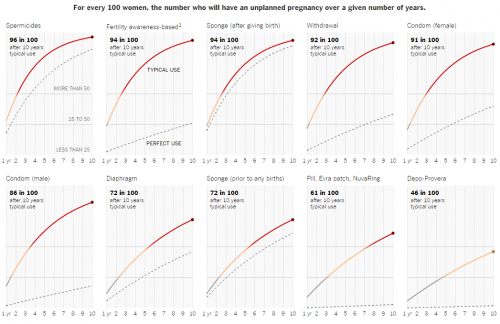
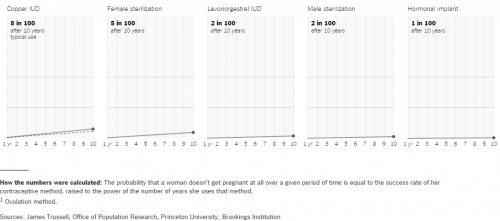
This week the New York Times published an interactive that illustrates the likelihood of pregnancy despite contraceptive use. Risk is divvied up by method, for perfect and typical use, and added up over ten years. The results are a little terrifying (click to see larger or go here to explore):

23

Somewhere around half of all pregnancies are unintended.  This is why. It’s hard enough to use contraceptives perfectly but, even when we do, the risk of failure is very real.

Male condoms are the safer sex favorite. But, even when used perfectly, almost one in five women will get pregnant over a ten year period. With typical use, more than four out of five. Withdrawal, one primary foil against which male condoms are usually recommended, is only slightly less effective at preventing pregnancy, as typically used.

The favorite of Americans — The Pill, as well as some other hormonal methods — is more effective than the condom, but not nearly as much as we think it is. Under ideal conditions, only three in 100 will get pregnant over ten years; in reality, almost two-thirds — 61 in 100 — will end up pregnant.

Only the most human-error resistant methods — the IUD, hormonal implants, and sterilization — near 100% effectiveness. These are permanent or semi-permanent and not real options for a large proportion of sexually active Americans during at least some parts of their lives.

Discussions of the right to an abortion and the ease with which they can be attained needs to be had with this information at the forefront of the discussion. Unintended pregnancies happen all the time to everyone.

Cross-posted at Pacific Standard.

Lisa Wade, PhD is an Associate Professor at Tulane University. She is the author of American Hookup, a book about college sexual culture; a textbook about gender; and a forthcoming introductory text: Terrible Magnificent Sociology. You can follow her on Twitter and Instagram.

Flashback Friday.

A website called Found in Mom’s Basement posted this vintage toilet paper ad that plays on the stereotype that Scottish people are cheap. From the post:

Although the stereotype of the cheap Scotsman isn’t as widely known in the U.S. today, going back a few decades it was an ethnic stereotype that was used freely, often making the Scots the butt of jokes.

6a00d83451ccbc69e20105370a813a970b-400wi

The post has links to several examples, such as the Studebaker Scotsman, a low-cost, minimal-options car. As a commenter to that post pointed out, Safeway’s store brand cigarettes, advertised as being inexpensive, was “Scotch Buy.” For a more recent example, we have McFrugal, a hardware site (now down):

picture-1

A reader, Julia, noted that Scotch tape was named that because:

it originally had adhesive only on the edges of the tape.  [An early user] told a 3M salesman to go back to his “Scotch bosses” (presumably too cheap to put adhesive all over the tape) and make it stickier.

The Scots-are-cheap stereotype is a great example of how ethnic stereotypes can lose their power. Maybe I’m just oblivious, but until a few years ago, I’d never heard of the stereotype that Scots were cheap. Without that context, the associations the ads are attempting to make would be meaningless to me — I would have just thought it was odd that McFrugal had a guy with bagpipes, but not understood that it might have any meaning. When I asked students in my race class about this, only a couple had ever heard this stereotype.

Obviously, though, it used to be a very common, widely-recognized notion. Much like the Irish and other European ethnic groups, as Scots became part of the larger “White” racial category, ethnic distinctiveness and stereotypes have become less prominent.

Originally posted in 2009.

Gwen Sharp is an associate professor of sociology at Nevada State College. You can follow her on Twitter at @gwensharpnv.

If you are worried about the abuse and exploitation of non-human animals, you can become a vegetarian or a vegan. But if you worry about the abuse and exploitation of humans, there is no morally upright consumer choice you can make, short of growing 100% of your food yourself.

This is the main message of journalist Eric Schlosser in this 4min video produced by BigThink. In it, he summarizes the extent of the exploitation of poor people, mostly immigrants, in the restaurant industry, the meatpacking industry, and the production of fresh fruits and vegetables in the U.S.

Especially for the people who pick our produce, he insists, the working conditions “are more reminiscent of the mid-nineteenth century than they are with the twenty-first century.” It is “literally slavery.”

Watch here:

Lisa Wade, PhD is an Associate Professor at Tulane University. She is the author of American Hookup, a book about college sexual culture; a textbook about gender; and a forthcoming introductory text: Terrible Magnificent Sociology. You can follow her on Twitter and Instagram.

Most Americans, when asked if they are affected by advertising, will say “not really.” They think other people are influenced by cultural messages, but that they are somehow immune.

Whether people are shaped by the media they consume seems to be a perpetual question. The fact that billions of dollars are spent every year attempting to influence us is probably a sign that advertisers know it works. Scientists get in on the action, asking pressing questions like: Do violent video games increase violence in real life? Do sexy, thin models hurt girls’ self-esteem? We do the studies and the answers are often inconclusive, probably because of how complicated the relationships are.

Psychologist Stefano Ghirlanda and his colleagues asked a slightly simpler question: Do celebrity dogs influence the popularity of dog breeds? They looked at 100 movies with prominent dog characters from 1939 to 2003 and compared the release date to breed registrations. The answer seems to be: with the exception of box office flops, yes.

2

Given that many dog movies are made for kids, I’d be interested in the mediating role of parenthood. Companies that make children’s products like sugary cereal know that they can get the parent to buy their product if the kid is annoying enough about it. So, they market to children directly. I’d love to see if people with and without small children were equally affected by the breed of dog in this year’s movie.

The researchers method of popularity, moreover, was registration with the American Kennel Club. Pure bred dogs are expensive. So, I wonder if the power of these trends varies by social class. If a family can’t afford a “Beethoven,” they may be more likely to just adopt a mutt from a neighbor’s litter.

In any case, though, this seems like incontrovertible evidence that we’re influenced by mass media. But you already knew everyone else was, didn’t you?

Lisa Wade, PhD is an Associate Professor at Tulane University. She is the author of American Hookup, a book about college sexual culture; a textbook about gender; and a forthcoming introductory text: Terrible Magnificent Sociology. You can follow her on Twitter and Instagram.