Editor’s Note: Christie W., Michel E., Andrew S., and an anonymous reader asked us to write about the recent discussion of Thylane Loubry Blondeau. We’re pleased to feature a guest blogger doing just that.
There is no shortage of sexualized images of girls in American culture. Shows like TLC’s Toddlers and Tiaras frequently contain over-the-top sexualized portrayals of girls. Images like these are undeniably sexualized.
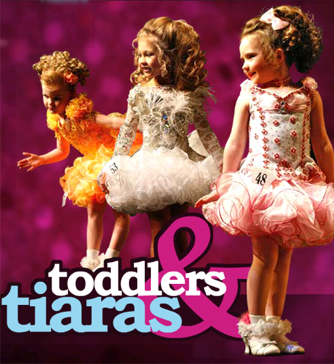
However, these images of Thylane Loubry Blondeau, a 10-year-old French model making headlines this week, are creating controversy instead of condemnation. Some argue that, unlike the child beauty queens, the photographs of Blondeau are art. There is an interesting class effect here; unlike the hypersexualized girls on shows like Toddlers and Tiaras, the photos of Blondeau are high fashion, therefore high class, and therefore acceptable.

I’m no prude. I think that children are – and have a right to be – sexual beings. However, there is a difference between sexuality (feeling sexual) and sexualization (being seen as sexy). I (and many other like-minded feminists) believe that girls should be sexual; but, sexualization (and its concomitant focus on appearance instead of desire) is bad because it denies girls’ sexual subjectivity in favor of sexual objectification.
There is ample psychological research to support this notion that sexualization is bad. An American Psychological Association Task Force on the Sexualization of Girls reported in 2007 that sexualization is linked with negative consequences such as disordered eating, low self-esteem, and deficits in cognitive and physical functioning. These links have been identified in both girls and women – some as young as Blondeau.
Sexualized images like these are troublesome at the societal level as well. They encourage others to view young girls as objects of sexiness. Additionally, these images are hugely problematic for girls and women with body image issues. The fashion industry already promotes the thin ideal. These pictures of Blondeau push the envelope by explicitly promoting the prepubescent thin ideal, a body type that is wholly unattainable for women. The normalization of beautifying a 10-year-old’s body type can have potentially disastrous consequences for women’s body image.
It is dangerous to assume that “high fashion” sexualization is “art” and therefore less of an issue than lower class sexualization. I do not take the paternalistic view that girls should be “protected” against sexualization. Instead, we should work with girls (and boys) to discourage sexualization and to encourage strength, intelligence, and sexual agency.
Images from tvtropes, Jezebel, and Snob.
Sarah McKenney is a doctoral candidate in developmental psychology at the University of Texas at Austin where she studies gender development and the sexualization of girls.