Cross-posted at Montclair SocioBlog.
If a person thinks that the media are infiltrating his mind and controlling his thoughts and behavior, we consider him a nutjob, and we recommend professional help and serious meds. But if a person thinks that the media are infiltrating other people’s minds and affecting their behavior, we call him or her an astute social observer, one eminently qualified to give speeches or write op-eds.
The previous post dwelt on economist Isabel Sawhill’s Washington Post op-ed channeling Dan Quayle, particularly Quayle’s speech asserting that a TV sitcom was wielding a strong effect on people’s decisions — not just decisions like Pepsi vs. Coke, but decisions like whether to have a baby.
That was Quayle, this is now. Still, our current vice-president can sometimes resemble his counterpart of two decades ago. Just a last month, Joe Biden echoed the Quayle idea on the power of sitcoms. On “Meet the Press,” in response to David Gregory’s question about gay marriage, Biden said that “this is evolving” and added:
And by the way, my measure, David, and I take a look at when things really begin to change, is when the social culture changes. I think “Will and Grace” probably did more to educate the American public than almost anything anybody’s ever done so far.
“Will and Grace” ran for eight seasons, 1998-2006. Its strongest years were 2001-2005, when it was the top rated show among the 18-49 crowd. Biden could point to General Social Survey (GSS) data on the gay marriage question. In 1988, ten years before “Will and Grace,” the GSS asked about gay marriage. Only 12% supported it, 73% opposed it. The question was asked again in 2004, six years into the W+G era. Support had more than doubled, and it continued to rise in subsequent years.
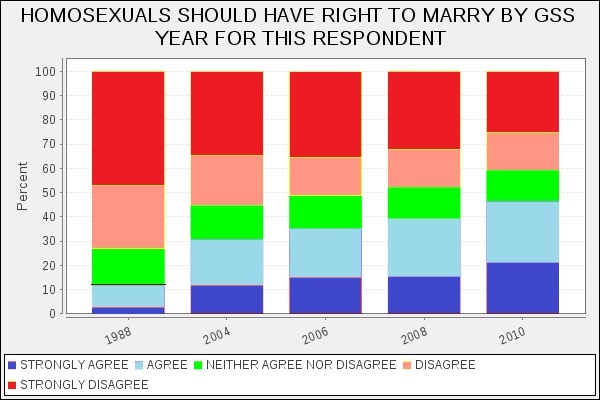
We don’t know just when in that 18-year period, 1988-2004, things “really began to change.” Fortunately, the GSS more regularly asked the respondent’s view on sexual relations between same-sex partners. Here too, tolerance grows in the “Will and Grace” period (gray on the graph):
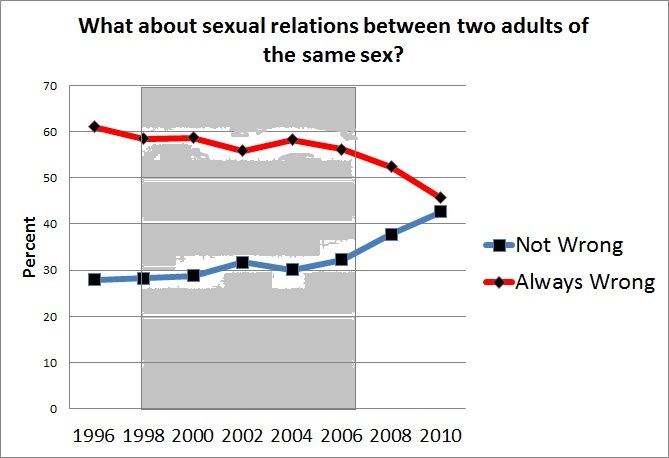
The graph is misleading, though. To see the error, all we need do is extend our sampling back a few years Here is the same graph starting in 1973:
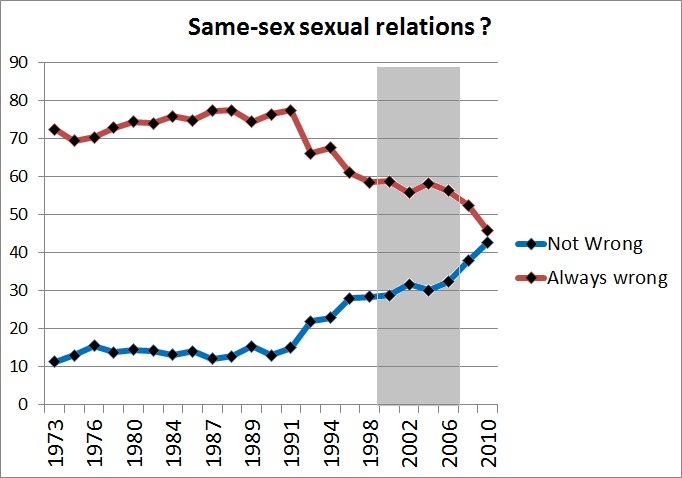
The GSS shows attitudes about homosexuality starting to change in 1990. By the time of the first episode of “Will and Grace,” the proportion seeing nothing wrong with homosexuality had already doubled. Like Quayle’s “Murphy Brown” effect, the “Will and Grace” effect is hard to see.
The flaw in the Quayle-Biden method is not in mistaking TV for reality. It’s in assuming that the public’s awareness is simultaneous with their own.
Why do our vice-presidents (and many other people) give so much credit (or blame) to a popular TV show for a change in public opinion? The error is partly a simplistic post hoc logic. “Will and Grace” gave us TV’s first gay principle character; homosexuality became more acceptable. Murphy Brown was TV’s first happily unwed mother, and in the following years, single motherhood increased. Besides, we know that these shows are watched by millions of people each week. So it must be the show that is causing the change.
It’s also possible that our vice-presidents (and many other people) may also have been projecting their own experiences onto the general public. Maybe Murphy Brown was the first or only unwed mother that Dan Quayle really knew – or at least she was the one he knew best. It’s possible that Joe Biden wasn’t familiar with any gay men, not in the way we feel we know TV characters. A straight guy might have some gay acquaintances or co-workers, but it’s the fictional Will Truman whose private life he could see, if only for a half hour every week.
Does TV matter? When we think about our own decisions, we are much more likely to focus on our experiences and on the pulls and pushes of family, work, and friends. We generally don’t attribute much causal weight to the sitcoms we watch. Why then are we so quick to see these shows as having a profound influence on other people’s behavior, especially behavior we don’t like? Maybe because it’s such an easy game to play. Is there more unwed motherhood? Must be “Murphy Brown.” Did obesity increase in the 1990s? “Roseanne.” Are twentysomethings and older delaying marriage? “Seinfeld” and “Friends.” And of course “The Simpsons,” or at least Bart and Homer, who can be held responsible for a variety of social ills.