Cross-posted at Reports from the Economic Front.

Wealth data is not easy to get.  Still for three years now, Credit Suisse Research Institute has published an annual Global Wealth Databook which attempts to estimate global wealth holdings.  The most recent issue includes data covering 2012.  According to Credit Suisse, the goal “is to provide the best available estimates of the wealth holdings of households around the world for the period since the year 2000.”

According to the publication, global household wealth was $222.7 trillion in mid-2012, equal to $48,500 for each of the 4.6 billion adults in the world.  Wealth is defined as “the marketable value of financial assets plus non-financial assets (principally housing and land) less debts.”

Not surprisingly, as the figure below shows, average global wealth varies considerably across countries and regions.

picture wealth

Also significant are the values of the mean vs the median wealth in each of the countries.  Mean or average wealth is calculated by dividing the total wealth of a country by its adult population.   Median wealth is the wealth holdings of the adult in the middle of the wealth distribution. The median is generally considered a far more reliable indicator of wealth because it is less sensitive to extremes at the top or bottom of the distribution.  The greater the divergence of mean and median wealth, the greater is the wealth inequality.

The table below provides mean and median wealth estimates for those countries with generally reliable data. As you can see, the U.S. ranks high in terms of mean wealth, trailing only 5 countries.  Things are quite different when it comes to median wealth; the U.S. trails 26 countries!  Not surprisingly, then, the U.S. is No. 1 when it comes to the mean/median wealth ratio, or wealth inequality.

global wealth

We clearly dominate in the number of millionaires and the upper global wealth categories.  Are we a wealthy country? Definitely.  Is that wealth concentrated in relatively few hands?  Definitely.

Martin Hart-Landsberg is a professor of economics at Lewis and Clark College. You can follow him at Reports from the Economic Front.

Cross-posted at Reports from the Economic Front.

Media and policy-makers seem anxious to convince us that the economy is in strong recovery mode, therefore, no further significant policy interventions are needed.

Their optimism appears to rest heavily on the recent acceleration in consumer spending.  After all, there are strong reasons for concern with the other major sources of growth:  government spending on all levels is being cut, exports face a weakening world economy, and business investment remains largely stagnate.

But there are also strong reasons to challenge this optimistic view of consumer spending as a growth engine.  The charts below, from a Wall Street Journal article, highlight some of the most important.

As we see below, while consumption spending is indeed accelerating, after tax personal income is falling.  In other words, there appears little reason to believe that there is a solid foundation for sustaining this trend.

1

Additionally, after four years of recovery we still have 2.4 million fewer jobs than we had at the start of the recession.  Moreover, as we see below, there has been no real wage growth.  In fact, real average wages have fallen for most of the so-called expansionary period.

2

Yes, housing values are finally starting to rise and household debt payments as a share of after-tax income are declining.  But to a large extent the new burst in consumption spending has more to do with renewed borrowing than solid gains in job creation and income.

Unfortunately, there is little reason for us to have confidence that the economy is gathering strength in ways that will be sustainable or benefit the great majority of working people.

Martin Hart-Landsberg is a professor of economics at Lewis and Clark College. You can follow him at Reports from the Economic Front.

We celebrate education as the answer to almost all our economic problems.  At the same time we largely ignore the enormous debt students are forced to acquire gaining a college degree and the great difficulties they face in landing a job that makes it possible for them to pay off that debt.

The Student Debt Problem

Student debt, as the Bloomberg Businessweek figure below highlights, is big and fast growing.

BW27_correlations_605a

As the figure shows, the share of Americans that have graduated college has steadily grown to a current high of 32%.  And, student debt has exploded.  It now stands at approximately $1 trillion, significantly higher than credit card debt and home equity loans (which are loans secured by a second mortgage).  Student debt is now second only to housing debt.

And, as Businessweek also points out, the share of young graduates suffering from debt is also on the rise.  In 2003, only 25% of 25 year old graduates had student loans.  In 2012, it was 43%.  Moreover, “Over half of all student debt is held by households whose net worth is under $8500.”

The Employment Problem

Of course, debt is only one side of the problem.  Lack of good employment is the other.  As an Economic Policy Institute (EPI) report explains:

The Great Recession that began in December 2007 was so long and severe, and the government response so inadequate, that the crater it left in the labor market continues to be devastating for workers of all ages. . . . The weak labor market has been, and continues to be, very tough on young workers: At 16.2%, the March 2013 unemployment rate of workers under age 25 was slightly over twice as high as the national average. Though the labor market is now headed in the right direction, it is improving very slowly, and the prospects for young high school and college graduates remain dim.

The figure below, taken from the EPI report, highlights just how bad the labor market is for recent college graduates.  It shows that the underemployment rate for college graduates that are 21-24 years old and not pursuing additional education is still over 18%.

employment

The underemployment measure used includes those officially listed as unemployed as well as those “that either have a job but cannot attain the hours they need, or want a job but have given up looking for work.” This measure does not “include ‘skills/education–based’ underemployment (e.g., the young college graduate working as a barista).”  The report cites one study that estimates that in 2000, 40% of employed college graduates under the age of 25 worked at jobs that did not require a college degree.  That rose to 47% in 2007 and 53% in 2012.

earnings

The table above, also from the EPI report, gives some sense of the wage pressure that young college graduates face.  It shows that their real hourly wages have significantly declined since 2000.

The Economic Consequences

If you think rising debt and poor employment opportunities cannot end well for graduates and the economy, you are right.  A post from the Naked Capitalism blog makes that clear:

Now that student loans are undeniably in bubble territory, the officialdom is starting to wake up and take notice. Evidence that students were taking on so much debt as a group that it was undermining their ability to be Good American Consumers wasn’t enough. . . .Student debt is senior to all other consumer debt; unlike, say, credit card balances, Social Security payments can be garnished to pay delinquencies. As a result, it has contributed to the fall in the home ownership rate, since many young people who want to buy a house can’t because their level of student debt prevents them from getting a mortgage.

Student loan delinquencies are getting into nosebleed territory. The Wall Street Journal, citing New York Fed data, tells us that student debt outstanding increased 4.6% in the last quarter [third quarter 2012]. Repeat: in the last quarter. Annualized, that’s a 19.7% rate of increase during a period when other consumer borrowings were on the decline. And this growth is taking place while borrower distress is becoming acute. 11% of the loans were 90+ days delinquent, up from 8.9% at the close of last quarter. The underlying credit picture is certain to be worse, since many borrowers aren’t even required to service loans (as in they are still in school or have gotten a postponement, which is available to the unemployed for a short period). And it was the only type of consumer debt to show rising delinquency rates.

This is the new subprime: escalating borrowing taking place as loan quality is lousy and getting worse.

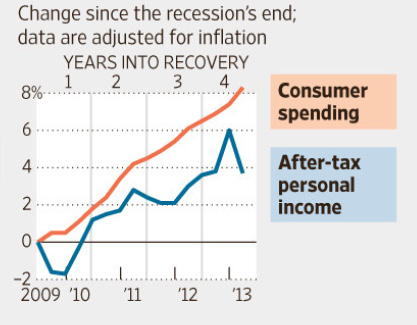
The following chart, from the Wall Street Journal, illustrates the trends noted above.

Falling Behind

If the situation wasn’t serious enough, because of a lack of Congressional action, the interest rate on new, subsidized Stafford loans—the loans that the federal government gives to college and university students with financial need—doubled on July 1, from 3.4% to 6.8%.  These loans account for more than a quarter of all new federal student loans.

It sure seems like we need to stop stressing individualistic solutions to our economic problems and start talking about making broader structural changes to our economic system.


Martin Hart-Landsberg is a professor of economics at Lewis and Clark College. You can follow him at Reports from the Economic Front.

While some austerity advocates really fear (although incorrectly) the consequences of deficit spending, the strongest proponents are actually only concerned with slashing government programs or the use of public employees to provide them.  In other words their aim is to weaken public programs and/or convert them into opportunities for private profit. One measure of their success has been the steady decline in public employment.  Floyd Norris, writing in the New York Times notes:

For jobs, the past four years have been a wash.

The December jobs figures out today indicate that there were 725,000 more jobs in the private sector than at the end of 2008 — and 697,000 fewer government jobs. That works into a private-sector gain of 0.6 percent, and a government sector decline of 3.1 percent.

In total, the number of people with jobs is up by 28,000, or 0.02 percent.

How does that compare? It is by far the largest four-year decline in government employment since the 1944-48 term. That decline was caused by the end of World War II; this one was caused largely by budget limitations.

The chart below, taken from the same post, also reveals just how weak private sector job creation has been over the past 12 years (compare the top three rows — the presidencies of Obama and Bush — w job changes This graphic from the New York Times highlights just how significant the decline in public employment has been in this business cycle compared with past ones.  Each line shows the percentage change in public sector employment for specified months after the start of a recession.  Our recent recession began December 2007 and ended June 2009.   As you can see, what is happening now is far from usual.

1

It is also worth noting that despite claims that most Americans want to see cuts in major federal government programs, the survey data show the opposite.  For example, see the following graphic from Catherine Rampell’s blog post. economix-22pewwhattocut-blog480 As Rampell explains:

In every category except for “aid to world’s needy,” more than half of the respondents wanted either to keep spending levels the same or to increase them. In the “aid to world’s needy” category, less than half wanted to cut spending.

Not surprisingly, this assault on government spending and employment will have real consequences for the economy and job creation. All of this takes us back to the starting point — we are talking policy here.  Whose interests are served by these trends?

Martin Hart-Landsberg is a professor of economics at Lewis and Clark College. You can follow him at Reports from the Economic Front.

Dylan Matthews, blogging in the Washington Post, discusses a very interesting paper that provides evidence showing that politicians seriously underestimate the progressivity of their constituents.

David Broockman and Christopher Skovron, the authors of the paper, “surveyed every candidate for state legislative office in the United States in 2012 [shortly before the November election] and probed candidates’ own positions and their perceptions of their constituents’ positions on universal health care, same-sex marriage, and federal welfare programs, three of the most publicly salient issues in both national-level and state-level American politics during the past several years.”  They then matched the results with estimates of the actual district- and issue-specific opinions of those residing in the candidates’ districts using a data set of almost 100,000 Americans.

Here is what they found:

Politicians consistently and substantially overestimate support for conservative positions among their constituents on these issues. The differences we discover in this regard are exceptionally large among conservative politicians: across both issues we examine, conservative politicians appear to overestimate support for conservative policy views among their constituents by over 20 percentage points on average… Comparable figures for liberal politicians also show a slight conservative bias: in fact, about 70% of liberal office holders typically underestimate support for liberal positions on these issues among their constituents.

The following two charts illustrate this bias when it comes to universal health care and same sex marriage.

1

As Matthews explain:

The X axis is the district’s actual views, and the Y axis their legislators’ estimates of their views. The thin black line is perfect accuracy, the response you’d get from a legislator totally in tune with his constituents. Lines above it would signify the politicians think the district more liberal than it actually is; if they’re below it, that means the legislators are overestimating their constituents’ conservatism. Liberal legislators consistently overestimate opposition to same-sex marriage and universal health care, but only mildly. Conservative politicians are not even in the right ballpark.

The authors found a similar bias regarding support for welfare programs.  Perhaps even more unsettling, the authors found no correlation between the amount of time candidates spent meeting and talking to people in their districts while campaigning for office and the accuracy of their perceptions of the political positions of those living in their districts.

One consequence of this disconnect is that office holders, even those with progressive views, are reluctant to take progressive positions.  More generally, these results speak to a real breakdown in “the ability of constituencies to control the laws that their representatives make on their behalf.”

Martin Hart-Landsberg is a professor of economics at Lewis and Clark College. You can follow him at Reports from the Economic Front.

Cross-posted at Reports from the Economic Front.

While newspapers give a lot of ink to arguments about whether reducing the budget deficit will boost or reduce growth, they seem to have little interest in the related issue of whether economic growth really benefits the great majority.

David Cay Johnston, the Pulitzer Prize winning financial journalist, recently addressed this issue drawing on the work of economists Emmanuel Saez and Thomas Piketty:

In 2011 entry into the top 10 percent… required an adjusted gross income of at least $110,651. The top 1 percent started at $366,623.

The top 1 percent enjoyed 81 percent of all the increased income since 2009. Just over half of the gains went to the top one-tenth of 1 percent, and 39 percent of the gains went to the top 1 percent of the top 1 percent.

Ponder that last fact for a moment — the top 1 percent of the top 1 percent, those making at least $7.97 million in 2011, enjoyed 39 percent of all the income gains in America.

So, 81 percent of all the new income generated from 2009 to 2011 was captured by the top 1 percent income earners, where income is defined as adjusted gross income, which refers to income minus deductions or taxable income.  In other words, growth, even accelerated growth, is not going to do the majority much good if the economic structure remains the same.

Johnston highlights the problem with our existing economic model with perhaps an even more shocking example.  He compares the average income growth of the bottom 90 percent with the average income growth of the top 10 percent, 1 percent, and top 1 percent of the top 1 percent over the period 1966 to 2011.

It turns out that the average income of the bottom 90 percent rose by a miniscule $59 over the period (as measured in 2011 dollars).  By comparison, the average income of the top 10 percent rose by $116,071, the average income of the top 1 percent rose by $628,817, and the average income of the top 1 percent of the top 1 percent increased by a whopping $18,362,740.  In short, growth alone means little if the great majority of people are structurally excluded from the benefits.

In an effort to highlight this extreme disparity in adjusted income growth rates, Johnston suggests plotting the numbers on a chart, with $59, the amount gained by the bottom 90 percent, represented by a bar one inch high.  As the chart below shows, the bar representing average gains for the top 10 percent would be 163 feet high, that for the top 1 percent would be 884 feet high, and that for the top 1 percent of the top 1 percent would be 4.9 miles high.

1

In sum, the real challenge facing the great majority of Americans is not figuring out how to make the economy growth faster.  Rather, it is figuring out how to create space for a real debate about how to transform our economy so that growth will actually satisfy majority needs.

Martin Hart-Landsberg is a professor of economics at Lewis and Clark College. You can follow him at Reports from the Economic Front.

Cross-posted at Reports from the Economic Front.

The British economy is a disaster.  Oddly enough most analysts find it difficult to explain why.

Actually the reason is quite simple. The British government responded to its own Great Recession by cutting spending and raising taxes.  The result, which is anything but mysterious, is that the county remains in deep recession.

Matthew O’Brien, writing in The Atlantic, describes the situation as follows:

…public net investment — things like roads and bridges and schools,  and everything else the economy needs to grow — has fallen by half the past three years, and is set to fall even further the next two. It’s the economic equivalent of shooting yourself in both feet, just in case shooting yourself in one doesn’t completely cripple you. Austerity has driven down Britain’s borrowing costs even further, but that’s been due to investors losing faith in its recovery, rather than having more faith in its public finances. Indeed, weak growth has kept deficits from coming down all that much, despite the higher taxes and slower spending. In other words, it’s economic pain for no fiscal gain.

Below is a chart taken from The Atlantic article.  It shows that:

Britain’s stagnating economy has left it in worse shape at this point of its recovery than it was during the Great Depression. GDP is still more than 3 percent below its 2008 peak, and it hasn’t done anything to catchup in years. At this pace, there will be no recovery in our time, or any other time.

 gdp to december 2012

In other words, while the British economy suffered a deeper decline during the Great Depression period of 1930 to 1934 than to this point in the Great Recession which started in 2008, the economy recovered far more quickly then than now.  In fact, it doesn’t seem to be recovering now at all.

Perhaps the most surprising thing about the situation is that political leaders appear determined to stay the course.

Martin Hart-Landsberg is a professor of economics at Lewis and Clark College. You can follow him at Reports from the Economic Front.

Cross-posted at Reports from the Economic Front.

The stock market looms large in our understanding of the economy.  The business news is often little more than a report on the movement of the market.  High school economics classes often introduce the study of the economy to students by encouraging them to pick and follow a favorite stock.  Managers of corporations are judged by how well their actions result in higher stock prices.

All this could easily lead one to think that the great majority of Americans are stockholders.  In fact, as the chart below shows, very few Americans own significant shares of stock and therefore directly benefit from the market’s rise.

It is easy to understand why the top earners are happy with this identification of the economy with the stock market.  It ensures that economic activity is largely organized and outcomes evaluated with their interests in mind.  What is not so easy to understand is why the great majority of working people continue to accept this identification.

Martin Hart-Landsberg is a professor of economics at Lewis and Clark College. You can follow him at Reports from the Economic Front.