A single event can take on great symbolic importance and change people’s perceptions of reality, especially when the media devote nearly constant attention to that event.  The big media story of the killing of Trayvon Martin and the trial of George Zimmerman probably does not change the objective economic, social, and political circumstances of Blacks and Whites in the U.S.  But it changed people’s perceptions of race relations.

A recent NBC/WSJ poll shows that between November of 2011 and July 2013, both Whites and Blacks became more pessimistic about race relations.

1 2

Since 1994, Americans had become increasingly sanguine about race relations.  The Obama victory in 2008 gave an added boost to that trend.  In the month of Obama’s first inauguration, nearly two-thirds of Blacks and four-fifths of Whites saw race relations as Good or Very Good (here’s the original data). But now, at least for the moment, the percentages in the most recent poll are very close to what they were nearly 20 years ago.

The change was predictable, given the obsessive media coverage of the case and the dominant reactions to it.  On one side, the story was that White people were shooting innocent Black people and getting away with it.  The opposing story was that even harmless looking Blacks might unleash potentially fatal assaults on Whites who are merely trying to protect their communities.  In both versions, members of one race are out to kill members of the other — not a happy picture of relations between the races.

My guess is that Zimmerman/Martin effect will have a short life, perhaps more so for Whites than Blacks. In a few months, some will ascend from the depths of pessimism. Consider that after the verdict in Florida there were no major riots, no burning of neighborhoods to leave permanent scars — just rallies that were for the most part peaceful outcries of anger and anguish.  I also, however, doubt that we will see the optimism of 2009 for a long while, especially if the employment remains at its current dismal levels.

Cross-posted at Montclair SocioBlog.

Jay Livingston is the chair of the Sociology Department at Montclair State University. You can follow him at Montclair SocioBlog or on Twitter.

Dispatcher: Which entrance is that that he’s heading towards?

Zimmerman: The back entrance… fucking punks.

Dispatcher: Are you following him?

Zimmerman: Yeah.

Dispatcher: Okay, don’t do that.

Zimmerman: Okay.

If you followed the Zimmerman/Martin killing at all, you probably recognized that this is not what the dispatcher said.  The correct transcript is:

Dispatcher: Okay, we don’t need you to do that.

Nowadays, we don’t tell people what to do and what not to do. We don’t tell them what they should or should not do or what they ought or ought not to do.  Instead, we talk about needs – our needs and their needs.  “Clean up your room” has become “I need you to clean up your room.”

The age of “there are no shoulds,” the age of needs, began in the 1970s and accelerated until very recently.   Here are Google n-grams for “you need to” and “they need to.”

1 2

 We don’t say, “The writers on ‘Mad Men’ ought to watch out for anachronistic language.” We say that they “need to” watch out for it.  It was Benjamin Schmidt’s Atlantic post (here) about “Mad Men” that alerted me to this ought/need change.  Schmidt created a chart showing the relative use of “ought to” and “need to.”

3

All the films and TV shows in the chart are set in the 1960s.  But the scripts that were actually written in the 60s are more likely to use “ought”; the 60s scripts written in the 21st century use “need.”

Real imperatives (“Stop that right now”) claim moral authority. So do ought and should. But need is not about general principles of right and wrong.  In the language of need, the speaker claims no moral authority over the person being spoken to. It’s up to the listener to weigh his own needs against those of the speaker and then make his own decision.

No wonder Zimmerman felt free to ignore the implications of the dispatcher’s statement.  It was not a command (“Don’t do that”), it did not assert authority or the rightness of an action (“You should not do that”).  It did not even state what the police department needed or wanted.  It merely said that Zimmerman’s pursuit of Martin was not necessary.  Not wrong, not ill-advised, just unnecessary.

If the dispatcher had spoken in the language of the 1960s and told Zimmerman that he should not pursue Martin, would Trayvon Martin be alive?  We cannot possibly know. But it’s reasonable to think it would have increased that probability.

Philip Cohen, for what it’s worth, tells me that a TV commentator said that dispatchers have a protocol of not giving direct orders.  If such an instruction led to a bad outcome, the department might be held accountable.  So police departments’ efforts to avoid lawsuits may also have contributed to Martin’s death or, at least, the not-guilty verdict for Zimmerman.

Cross-posted at Montclair SocioBlog.

Jay Livingston is the chair of the Sociology Department at Montclair State University. You can follow him at Montclair SocioBlog or on Twitter.

Cross-posted at Montclair SocioBlog.

According to an op-ed in the Times, America is the global leader in broadband, with high speeds and great service. And it’s all because the government restrained “onerous” regulation and let companies like Verizon do what they want and charge what they want.

It was written by the CEO of Verizon, Lowell McAdam.

I pay Mr. McAdam’s company about $115 each month for my land line, wi-fi, and cable (all FIOS).  Mr. McAdam compares the U.S. favorably with Europe, “where innovation and investment in advanced networks have stagnated under an onerous regulatory regime.”  I asked a friend who lives in Paris what he pays for his FIOS phone, wi-fi, and cable.  The monthly bill:  39.90€ ($52) or half of what I pay Verizon.  Maybe there’s an upside to stagnant and onerous.

There’s nothing wrong with getting what you can afford, and it occurred to me that U.S. broadband is the best because we can afford more.  Onerous regulations or no, most other countries are not as rich as the U.S.  What if you looked at broadband and per capita GDP?

The OECD did just that with data from June 2012 (their several spreadsheets on this are here). The purple bars are broadband penetration and the bumpy red line is GDP per capita. Do you see a correlation?

1

Consider France: As of a year ago, the country had greater broadband penetration despite a lower per capita GDP than the U.S. ($35,133 vs. $46,588); that’s 25% more broadband on 33% less income and at half the cost to consumers.

If you re-rank the OECD countries factoring in per capita GDP, the line-up changes.  Notably, the U.S. and Luxembourg drop well below the OECD average, despite being among the wealthiest countries.

2

Of course, not all broadbands are equally broad.  Verizon sold me on fiber-optic with their assurance that it was dazzlingly faster than their DSL that I had been clunking along on. This graph breaks down broadband into its various incarnations.

3

The U.S. is slightly above average on all broadband, but when it comes to a high fibre diet, we are ahead of several other countries that have greater total penetration.  On the other hand, the Scandinavian countries are ahead of us, as are, impressively, the Asian countries.

This is not to deny U.S. advances.  TechCrunch summarizes more recent data from Akamai on these changes:

the U.S. is currently second in the price of broadband for entry-level users. The nation is also third in network-based competition, second in the fiber-optic installation rate, first in the adoption of next-generation LTE, ahead of Europe in broadband adoption, and doing quite well in Internet-based services.

Still, the U.S. lags behind other, less wealthy countries.  InnovationFiles, using Akamai data for different variables, has a less congratulatory view.

  • The U. S. has picked up one place in the “Average Peak Connection Speed” that’s the best measurement of network capacity, rising from 14th to 13th as the measured peak connection speed increased from 29.6 Mbps to 31.5 Mbps.
  • In terms of the “Average Connection Speed,” widely cited by analysts who don’t know what it means, the U. S. remains in 8th place world-wide. but we’re no longer tied for it as we were in the previous quarter; Sweden is right behind us on this one.
  • In terms of “High Speed Broadband Adoption”, the proportion of IP addresses with an Average Connection Speed greater than 10 Mbps, we remain in 7th place, but now we’re tied with  Sweden.

The title of CEO McAdam’s op-ed is “How the US Got Broadband Right.”  Given the content, I  guess “We’re Number 13!” wouldn’t have been appropriate.  Even “We’re Number Seven (Tied With Socialist Sweden)!” doesn’t quite have that affirmative zing.

Jay Livingston is the chair of the Sociology Department at Montclair State University. You can follow him at Montclair SocioBlog or on Twitter.

Cross-posted at Montclair Socioblog.

We got another reminder last week that despite complaints about federal government programs that give money to the poor, when it comes to taxes, the government is much more generous to the wealthy.  The news came from a report from the Congressional Budget Office on tax expenditures.

These are the ways that the government uses the tax system to give money to people. Some expenditures are tax credits, which can take the form of cash payments.  Others are tax breaks — taxing people less than the going rate. For example, if I am in the 35% tax bracket, but the government charges me only 15% on the $100,000 I made playing the stock market, the government is giving me $20,000 it could otherwise have had me pay in taxes. That’s an expense. The preferential rate for my luck in the market costs the government $20,000.

The justification for these expenditures is that they are a way the government can encourage people to do something that it wants them to do.  With tax breaks, the government is basically paying people by not charging them full tax fare — encouraging them to buy a house or give to charity or get health insurance at their work.  Similarly with the tax credits that go mostly to the poor. We want people to hold a job and to care for their kids.  The child tax credit gives people more money to care for their children.  The Earned Income Tax Credit pays them for working, even at jobs that pay very little.  By the same logic, the government is paying me to invest my money in companies — or put another way, to play the stock market.

This government largesse, however, benefits some people more than others:

1

About half of all tax expenditures go to the top quintile (top 20% of income earners).  The bottom 80% of earners divide the other half.  And within that richest quintile, the top 1% receive 15% of all tax expenditures (this distribution of tax breaks roughly parallels the distribution of income). Were you really expecting Sherwood Forest?

Here is a breakdown of the costs of these different tax expenditures:

2

The Earned Income Tax Credit, which benefits mostly the poor, costs less than $40B.  The tab for the low tax on investment income (capital gains and dividends) is more than twice that, and nearly all of that goes to the top quintile.  More than two-thirds goes to the richest 1%.

Dylan Matthews at the Washington Post WonkBlog regraphed the numbers to show the total amounts overall plus the amounts in each category for each income group:

3

The point? People complain about government payments to the poor, but tax breaks are also payments, though less obviously so, to the rich.  And those tax breaks cost the government a lot more money.

Jay Livingston is the chair of the Sociology Department at Montclair State University. You can follow him at Montclair SocioBlog or on Twitter.

Cross-posted at Montclair SocioBlog.

The magic of demographic knowledge is a memorable moment in John Sayles’s 1984 movie “Brother From Another Planet.” On the A train, a young man shows an elaborate card trick to the title alien, who looks like an African American but seems to have no understanding of the trick. So the magician offers another.

From 59th St. to 125th St. is one stop on the express.  But as the movie shows, that short ride covers a large demographic change, and it’s not just racial.  The New Yorker has posted interactive graphics showing the median income of the census tracts surrounding subway stations.

1

Take the A train one stop — from the southern border of Central Park to a few blocks above its northern border — and see median income drop by $100,000.

Many other lines travel the extremes of economic inequality.  My line is the 2:

2

In the early morning commute, I see blue collar workers in their hoodies or rough jackets and steel-toe boots next to well-dressed people reading The Wall Street Journal.  They didn’t get on at the same stop.  The people who live in and work in the Wall Street census tract, which includes Park Place, are not on the train.  Here’s what their housing looks like:

BATTERY PARK CITY: as a pioneer. It's all Green, environmentally friendly.

And here is Franklin St., Brooklyn:

4

The subway demographic trick is not limited to New York. Here’s a time-lapse video of the Red Line of Chicago’s CTA.

Despite the social class segregation in housing, in cities like New York and Chicago, people of vastly different economic circumstances are likely to share the same subway car, at least for a few stops.  Yet I don’t get a sense of strong resentment or even envy among the have-nots (though I wish I had systematic data on this).  This is similar to the findings of Rachel Sherman, who studied how workers at high-end hotels thought of their guests.

New York and Chicago, however, are also where the rich are more likely to be liberal and in favor of redistributionist policies.  As Andrew Gelman has shown, the wealthy in rich states are far more liberal than the wealthy in poor states.  That may be partly because in rich states, the wealthy live in the large cities.  It would be interesting to see if we saw the same effect if we looked at Upstate New York, Downstate Illinois, or Massachusetts outside Rte. 128.

HT: Jenn Lena for the link.

Jay Livingston is the chair of the Sociology Department at Montclair State University. You can follow him at Montclair SocioBlog or on Twitter.

Cross-posted at Montclair SocioBlog.

Forty years ago Richard Easterlin proposed the paradox that people in wealthier countries were no happier than those in less wealthy countries.  Subsequent research on money and happiness brought modifications and variations, notably that within a single country, while for the poor, more money meant fewer problems, for the wealthier people — those with enough or a bit more — enough is enough.  Increasing your income from $100,000 to $200,000 isn’t going to make you happier.

It was nice to hear researchers singing the same lyrics we’ll soon be hearing in commencement speeches and that you hear in Sunday sermons and pop songs (“the best things in life are free”; “mo’ money mo’ problems”).  But this moral has a sour-grapes taste; it’s a comforting fable we non-wealthy tell ourselves all the while suspecting that it probably isn’t true.

A recent Brookings paper by Betsey Stevenson and Justin Wolfers adds to that suspicion.  Looking at comparisons among countries and within countries, they find that when it comes to happiness, you can never be too rich.

1

Stevenson and Wolfers also find no “satiation point,” some amount where happiness levels off despite increases in income.  They provide US data from a 2007 Gallup survey:

2

The data are pretty convincing.  Even as you go from rich to very rich, the proportion of “very satisfied” keeps increasing.  (Sample size in the stratosphere might be a problem: only 8 individuals reported annual incomes over $500,000;100% of them, though, were “very happy.”)

Did Biggie and Alexis get it wrong?

Around the time that the Stevenson-Wolfers study was getting attention in the world beyond Brookings, I was having lunch with a friend who sometimes chats with higher ups at places like hedge funds and Goldman Sachs.  He hears wheeler dealers complaining about their bonuses. “I only got ten bucks.”  Stevenson and Wolfers would predict that this guy’s happiness would be off the charts given the extra $10 million.  But he does not sound like a happy master of the universe.

I think that the difference is more than just the clash of anecdotal and systematic evidence.  It’s about defining and measuring happiness.  The Stevenson-Wolfers paper uses measures of “life satisfaction.”  Some surveys ask people to place themselves on a ladder according to “how you feel about your life.”  Others ask

All things considered, how satisfied are you with your life as a whole these days?

The GSS uses happy instead of satisfied, but the effect is the same:

Taken all together, how would you say things are these days – would you say that you are very happy, pretty happy, or not too happy?

When people hear these questions, they may think about their lives in a broader context and compare themselves to a wider segment of humanity.  I imagine that Goldman trader griping about his “ten bucks” was probably thinking of the guy down the hall who got twelve.  But when the survey researcher asks him where he is on that ladder, he may take a more global view and recognize that he has little cause for complaint.  Yet moment to moment during the day, he may look anything but happy.  There’s a difference between “affect” (the preponderance of momentary emotions) and overall life satisfaction.

Measuring affect is much more difficult — one method requires that people log in several times a day to report how they’re feeling at that moment — but the correlation with income is weaker.

In any case, it’s nice to know that the rich are benefitting from getting richer.  We can stop worrying about their being sad even in their wealthy pleasure and turn our attention elsewhere.  We got 99 problems, but the rich ain’t one.

Jay Livingston is the chair of the Sociology Department at Montclair State University. You can follow him at Montclair SocioBlog or on Twitter.

Cross-posted at Montclair SocioBlog.

Does “the abortion culture” cause infanticide?  That is, does legalizing the aborting of a fetus in the womb create a cultural, moral climate where people feel free to kill newborn babies?

It’s not a new argument.  I recall a 1998 Peggy Noonan op-ed in the Times, “Abortion’s Children,” arguing that kids who grew up in the abortion culture are “confused and morally dulled.”*  Earlier this week, USA Today ran an op-ed by Mark Rienzi repeating this argument in connection with the Gosnell murder conviction.

Rienzi argues that the problem is not one depraved doctor.  As the subhead says:

The killers are not who you think. They’re moms.

Worse, he warns, infanticide has skyrocketed.

While murder rates for almost every group in society have plummeted in recent decades, there’s one group where murder rates have doubled, according to CDC and National Center for Health Statistics data — babies less than a year old.

Really? The FBI’s Uniform Crime Reports has a different picture.

1

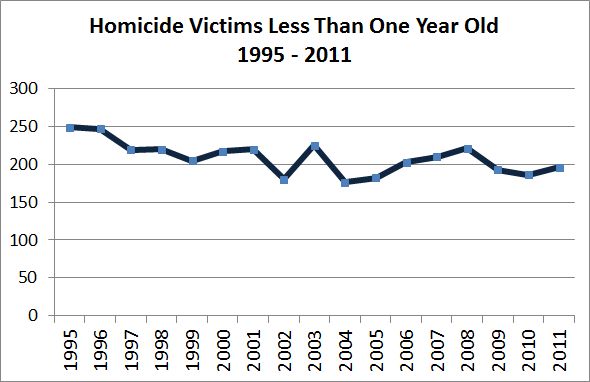
Many of these victims were not newborns, and Rienzi is talking about day-of-birth homicides — the type killing Dr. Gosnell was convicted of, a substitute for abortion.  Most of these, as Rienzi says are committed not by doctors but by mothers.  I make the assumption that the method in most of these cases is smothering.  These deaths show an even steeper decline since 1998.

2

Where did Rienzi get his data that rates had doubled?  By going back to 1950.

3

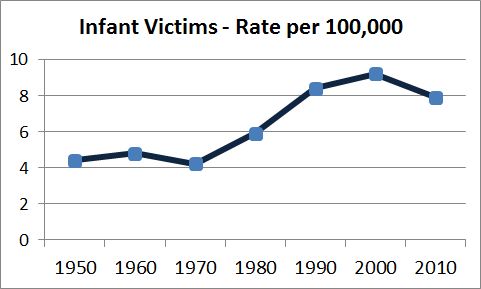
The data on infanticide fit with his idea that legalizing abortion increased rates of infanticide.  The rate rises after Roe v. Wade (1973) and continues upward till 2000.

But that hardly settles the issue. Yes, as Rienzi says, “The law can be a potent moral teacher.”  But many other factors could have been affecting the increase in infanticide, factors much closer to actual event — the mother’s age, education, economic and family circumstances, blood lead levels, etc.

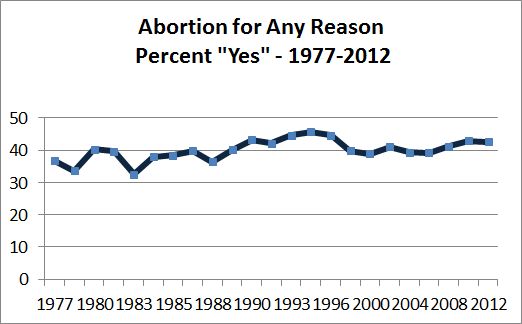
If Roe changed the culture, then that change should be reflected not just in the very small number of infanticides but in attitudes in the general population.  Unfortunately, the GSS did not ask about abortion till 1977, but since that year, attitudes on abortion have changed very little.   Nor does this measure of “abortion culture” have any relation to rates of infanticide.

4

Moreover, if there is a relation between infanticide and general attitudes about abortion, then we would expect to see higher rates of infanticide in areas where attitudes on abortion are more tolerant.

5

The South and Midwest are most strongly anti-abortion, the West Coast and Northeast the most liberal.  So, do these cultural difference affect rates of infanticide?

1

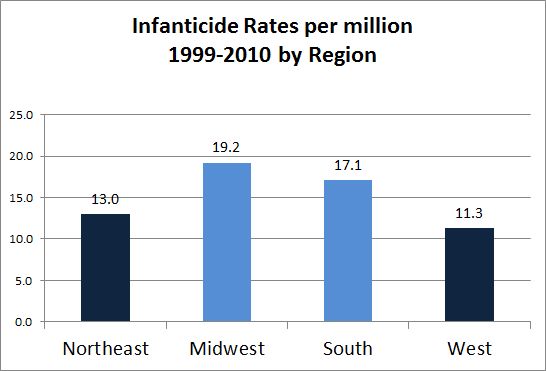
Well, yes, but it turns out the actual rates of infanticide are precisely the opposite of what the cultural explanation would predict.  The data instead support a different explanation of infanticide: Some state laws make it harder for a woman to terminate an unwanted pregnancy.  Under those conditions, more women will resort to infanticide.  By contrast, where abortion is safe, legal, and available, women will terminate unwanted pregnancies well before parturition.

The absolutist pro-lifers will dismiss the data by insisting that there is really no difference between abortion and infanticide and that infanticide is just a very late-term abortion. As Rienzi puts it:

As a society, we could agree that there really is little difference between killing a being inside and outside the womb.

In fact, very few Americans agree with this proposition. Instead, they do distinguish between a cluster of a few fertilized cells and a newborn baby. I know of no polls that ask about infanticide, but I would guess that a large majority would say that it is wrong under all circumstances.  But only perhaps 20% of the population thinks that abortion is wrong under all circumstances.

Whether the acceptance of abortion in a society makes people “confused and morally dulled” depends on how you define and measure those concepts.  But the data do strongly suggest that whatever “the abortion culture” might be, it lowers the rate of infanticide rather than increasing it.

* I had trouble finding Noonan’s op-ed at the Times Website.  Fortunately, then-Rep. Talent (R-MO) entered it into the Congressional Record.

Jay Livingston is the chair of the Sociology Department at Montclair State University. You can follow him at Montclair SocioBlog or on Twitter.

Cross-posted at Montclair SocioBlog.

The Washington Post has provided some data on medical costs across a selection of countries (Argentina, Canada, Chile, and India in grey; France, Germany, Switzerland, and Spain in blue; and the U.S. in red). The data reveal that American health care is very expensive compared to other countries.

1

No wonder the US spends twice as much as France on health care.  In 2009, the U.S. average was $8000 per person; in France, $4000.  (Canada came in at $4800).  Why do we spend so much?  Ezra Klein quotes the title of a 2003 paper by four health-care economists:  “it’s the prices, stupid.”

And why are US prices higher?  Prices in the other OECD countries are lower partly because of what U.S. conservatives would call socialism – the active participation of the government.  In the U.K. and Canada, the government sets prices.  In other countries, the government uses its Wal-Mart-like power as a huge buyer to negotiate lower prices from providers.  (If it’s a good thing for Wal-Mart to bring lower prices for people who need to buy clothes, why is it a bad thing for the government to bring lower prices to people who need to buy, say, an appendectomy? I could never figure that out.)

There may also be cultural differences between the U.S. and other wealthy countries, differences about whether greed, for lack of a better word, is good.  How much greed is good, and in what realms is it good?  Klein quotes a man who served in the Thatcher government:

Health is a business in the United States in quite a different way than it is elsewhere.  It’s very much something people make money out of. There isn’t too much embarrassment about that compared to Europe and elsewhere.

So we Americans roll along, paying several times what others pay for medical procedures, doctor visits, and drugs.

Jay Livingston is the chair of the Sociology Department at Montclair State University. You can follow him at Montclair SocioBlog or on Twitter.