Search results for twitter

Here are some summary statistics for the American Sociological Association annual meetings held this past week in Las Vegas. These statistics begin August 1st through the 25th.

TwapperKeeper archive URL: <http://twapperkeeper.com/hashtag/asa2011>
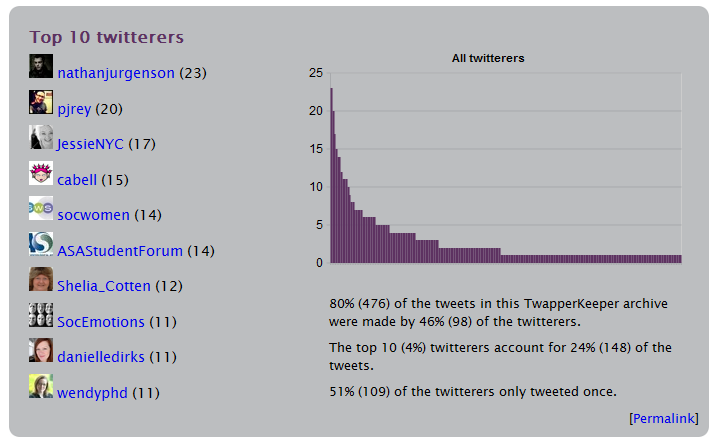
Total tweets: 3475
Total twitterers: 559
Total hashtags tweeted: 344
Total URLs tweeted: 336 more...

Tweet archive for ASA 2011

TwapperKeeper archive URL: <http://twapperkeeper.com/hashtag/ASA2011>

Total tweets: 1349
Total twitterers: 317
Total hashtags tweeted: 157
Total URLs tweeted: 143 more...

Tweet archive for ASA 2011

TwapperKeeper archive URL: http://twapperkeeper.com/hashtag/ASA2011

Total tweets: 596
Total twitterers: 211
Total hashtags tweeted: 86
Total URLs tweeted: 90

Twitter users set two new records for tweets per second on Sunday during the FIFA Women’s World Cup. The top spot goes to the championship game between USA and Japan, with 7,196 tweets per second at the end of the match. The Paraguay vs. Brazil game takes the number-two spot with 7,166 tweets per second. Putting this in context, this surpasses both the super bowl (4,063 tweets per second) and the 2010 Men’s World Cup final (3,283 tweets per second). If soccer is the world’s game, we see here a global community, where physically and geographically dispersed people come to share in a conversation. Moreover, we see the increasing integration of new technologies as an integral part of social experience, as tweets about the game became part of the event itself, and the event, by setting a new tweets/second record, became part of technological history.


The orange represents the intensity of Flickr images taken and geotagged to a particular area. The blue is Twitter use. Looking at New York City above, we see that people tweet from different places than they photograph. For example, tourists photograph some areas while people tweet more from work and home.

More images after the jump. Viamore...

Follow us! We’ll be Tweeting updates about the blog and other, related cyborgology projects (including a DC meetup that’s in the works!)

Theorizing the Web 2011 featured several projected installations.  In this post, I want to highlight the Twitter visualize produced by Vicky Lai, an undergraduate at the University of Maryland. Vicky explained her project to me, saying:

The tweet cloud generator was inspired by research with the Social Media Micro-Modeling group at UMD and started as a final project for a Digital Cultures and Creativity course. Originally designed to visualize popular words in a Twitter user’s social network (of followers/following to a certain depth), the project was modified to collect tweets containing “#ttw2011” and visualize the most frequent words. Word clouds are generated by IBM’s word cloud generator, the program used on the popular Wordle site.

The visualization automatically regenerated a couple times each minute, which enabled attendees to watch different words trend over time as the conversation in the conference itself shifted. more...

“African-American and Latino adults in the US who use the internet are twice as likely as whites to use the website Twitter.” [Note: it might be best to strike the words “the website” from that sentence since many access the service using other sites and mobile applications.]

Via the BBC.

A few years ago, being immersed in my doctoral research about Instagram images and the Manchester Arena attack, I was perhaps too aware of the kinds of images users shared on social media in the aftermath of a crisis. The national flags, the cityscapes and of course the ever-present stylised hearts with the relevant city superimposed, usually accompanied by a #PrayForX. Dutifully, I waded through my dataset each day, assigning categories and themes to these images, identifying patterns.

Enter Friday, 15 March, 2019. I hear the news that 51 people have been killed in my home country, New Zealand. It’s the first act of terrorism the country has ever witnessed. 18,000 kilometres away in Sweden, I’m struggling to piece together this distant and yet extremely close picture. The fragmented scene emerges: two mosques in Christchurch, one of our biggest cities, a white supremacist opens fire on worshippers while claiming to rid the country of “intruders”.

Halfway around the world in another time zone, I cling to scraps of information. All I can think to do is reach for my phone. My cousin sends me a message on Instagram with one word: “awful”. Looking at my feed, I’m instantly confused. It’s flooded with stylised images of New Zealand flags, and what seems like an endless stream of pink hearts, all proclaiming #PrayForNZ and ‘Christchurch’. The images are so familiar to me, eerily identical to those shared after the Manchester attack, almost two years earlier. more...

https://educators.aiga.org/

The following is a transcript of my brief remarks as part of a panel with Jenny L. Davis (@Jenny_L_Davis) about her recent book How Artifacts Afford:The Power and Politics of Everyday Things. The panel was hosted by the AIGA Design Educators Community and my role was to tie Jenny’s book to practices in the contemporary design classroom and to examine how today’s design students can benefit from observing their world through a critical affordance lens, delineated by the book’s ‘mechanisms and conditions framework’ 

more...