Our favorite economist, Martin Hart-Landsberg, has written a detailed account of what is causing the rise of income inequality around the world. Here I’d like to highlight just one of his really interesting observations.
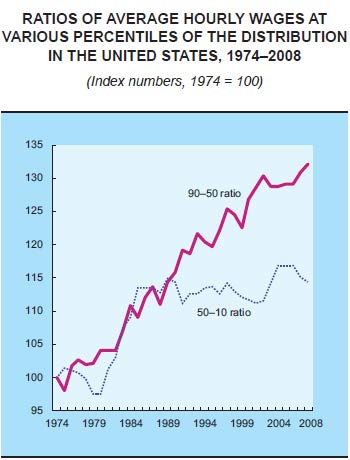
While we usually think that rising income inequality is caused by the rich getting richer and the poor getting poorer, a more complex picture is emerging. The graph below plots the hourly wages of the 90th percentile (Americans who make more than 89% of the population) relative to the wages of the 50th percentile (the purple line) and the wages of the 50th compared to the 10th percentile (the dotted blue line).
In English: it asks how quickly the richest people (90th) are pulling away from the average person (50th) and how quickly the average person is pulling away from the poorest (10th). The answer? Income inequality has been increasing since the 70s but, since the late ’80s, rich people have continued pulling ahead of the average American, but the average American has not been gaining on the poor.
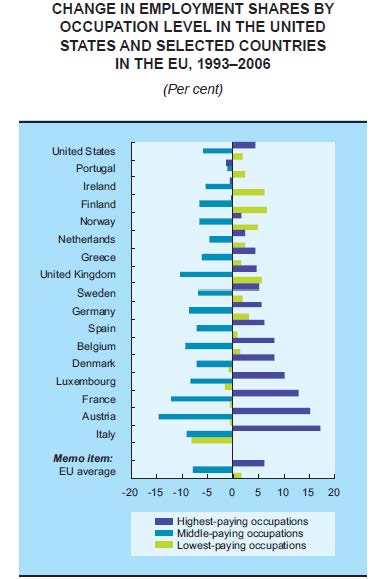
Another indicator that the middle class is shrinking is changes in the share of jobs that are low-, middle-, or high-paid. The next graph shows that, across a wide range of countries, high- and low-paying jobs are on the rise, but middle-paying jobs are on the decline. So, middle income jobs are disappearing, but there are more of both high- and low-income jobs.
Hart-Landsberg suggests that the reason for this shift in the economy involves the globalization of production. For more, visit Reports from the Economic Front.
Lisa Wade, PhD is an Associate Professor at Tulane University. She is the author of American Hookup, a book about college sexual culture; a textbook about gender; and a forthcoming introductory text: Terrible Magnificent Sociology. You can follow her on Twitter and Instagram.