
When most people think about “globalization”  they likely think about the global economy. In the more recent era, globalization was pushed into public debate in the 1990s when NAFTA (the North American Free Trade Agreement) was being debated and the WTO, World Bank and IMF were making significant strides in implementing the neoliberal economic model on a global scale. In a previous post I wrote about global commodity chains, here I will explore some of the ways that the global economy is measured and tracked.
The value of imports and exports, along with foreign direct investment (FDI) are the most common measures of economic globalization. How much stuff is crossing national borders to be bought, sold, or assembled in another nation? How much money is coming from investors from overseas? For a time, many may have assumed that globalization was something that would just continue to grow. New data assembled by McKinsey & Company, a global management consulting firm, shows a peak in the percentage of the global economy that came from the cross-border trade of goods, services and financial flows in 2007. Since then, the percentage of global GDP from “globalization” has dropped from over 50% to just above a third of the world’s GDP. After three decades of growth, globalization seems to be slowing. Whether the trend will continue is yet to be seen.
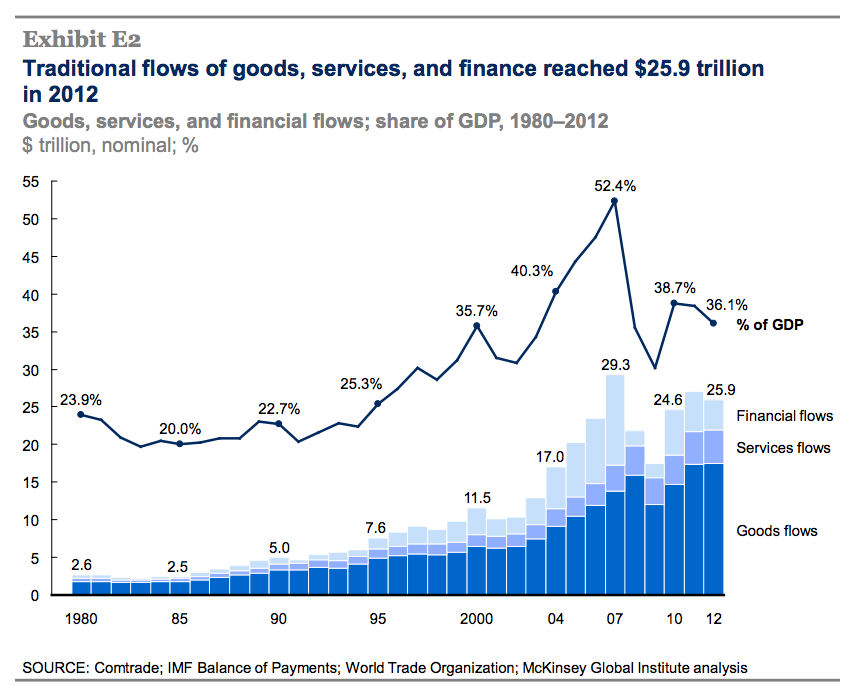
Additionally, the figure above shows the continued dominance of goods over services and financial flows in the role of the global economy.
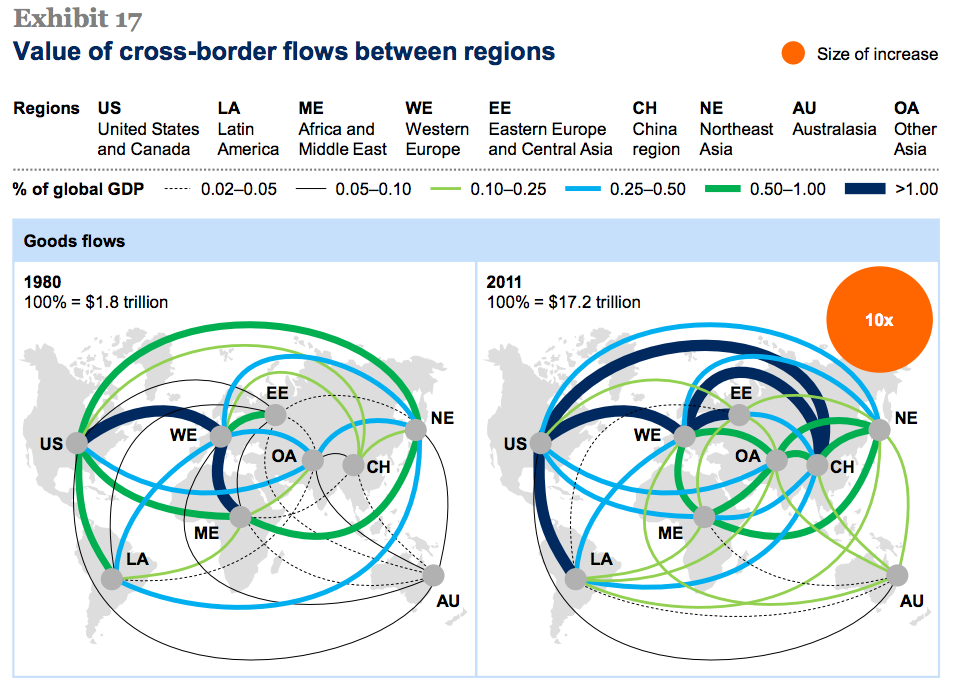
By 2011, the trade of goods was becoming much more global (beginning to live up to its name). In the figure below, the thicker the line, the larger the percentage of global GDP accounted for by cross-border trade between the regions. In 1980, we see trade between Western Europe and North America and between Western Europe and the Middle East/Africa as the most dominant routes of exchange. Three decades later, trade between numerous regions has become over 1.00% of global GDP.
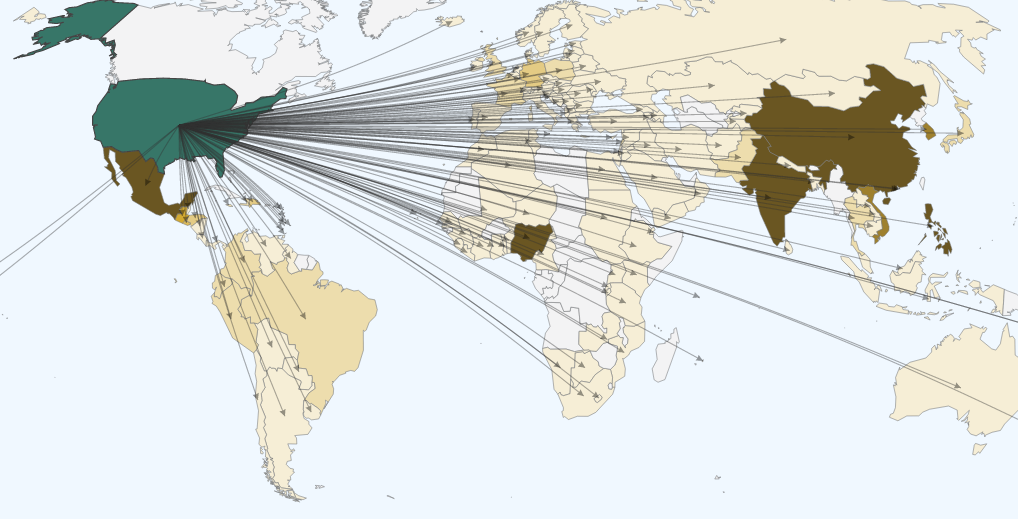
Another source of flows of capital across national boundaries is remittances, wages that foreign workers send back home. The Pew Research Center has an interactive tool that maps the 2012 flows from most countries in the world. It is a fascinating indirect look at the flow of labor and subsequently wages. Below you can see how far and wide wages from the US get spread through remittances.
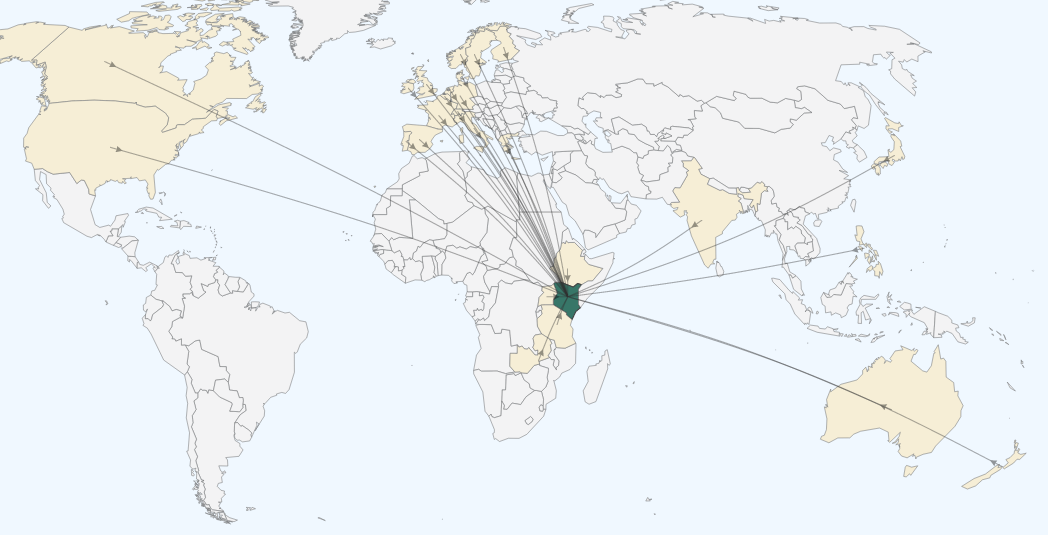
Compare the outgoing flows from the US, to the incoming flows to Kenya below.
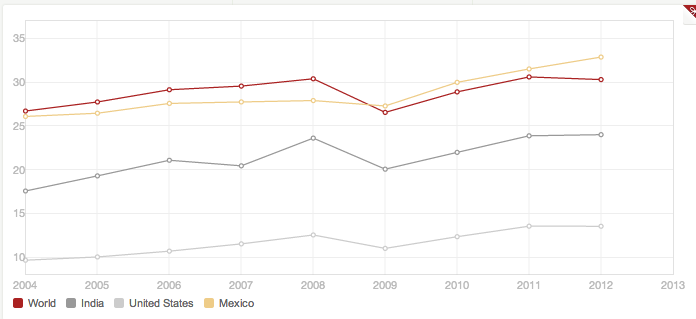
The World Bank also provides country level data on various measures of trade: exports (volume, value, and percent of GDP), imports, energy imports, and high-tech exports. Their data tools include a simple and fast graph-making tool that allows you or your students to select specific indicators and nations, allowing for cross-national comparison. Below we see that, compared to the world, Mexico and India in particular, the percentage of GDP from exports in the US is quite low.
Hopefully, these tools help students understand some of the primary elements of globalization and their trends.
Teach well, it matters.
. . .
August 2015
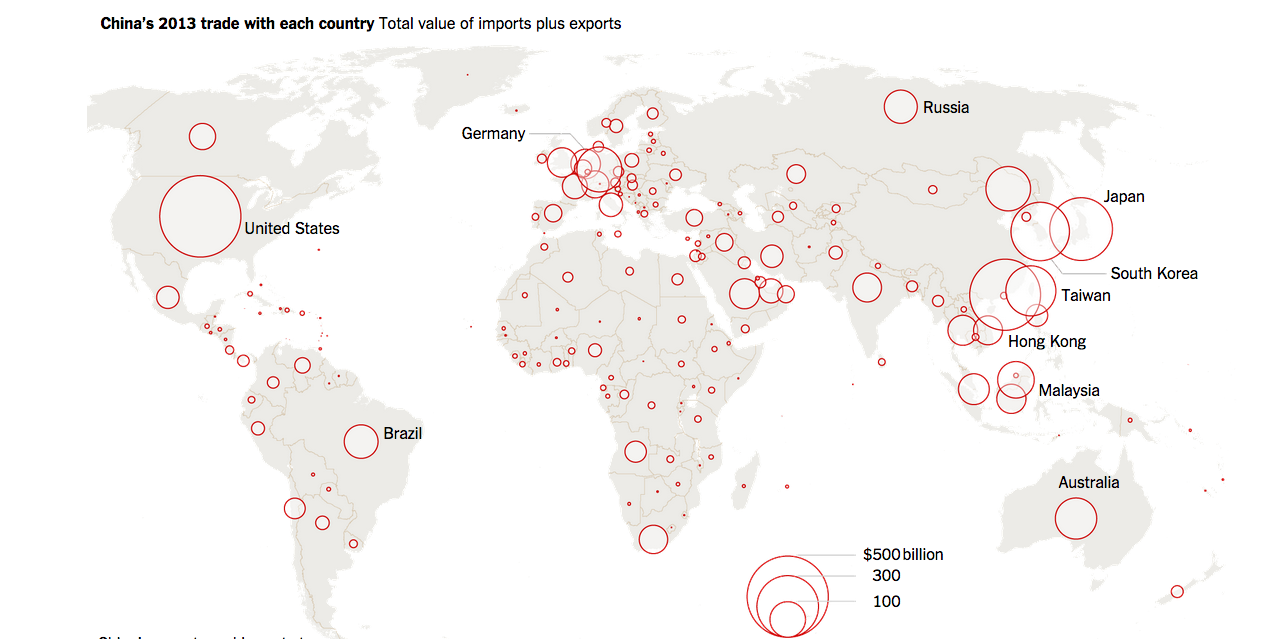
China’s economy is increasing tied to the global economy and vice versa. Below is a recent map from the New York Times that illustrates the influence of the Chinese economy on different nations around the world. Click on the image to go to the original article.
. . .
Comments