race/ethnicity: Whites/Europeans

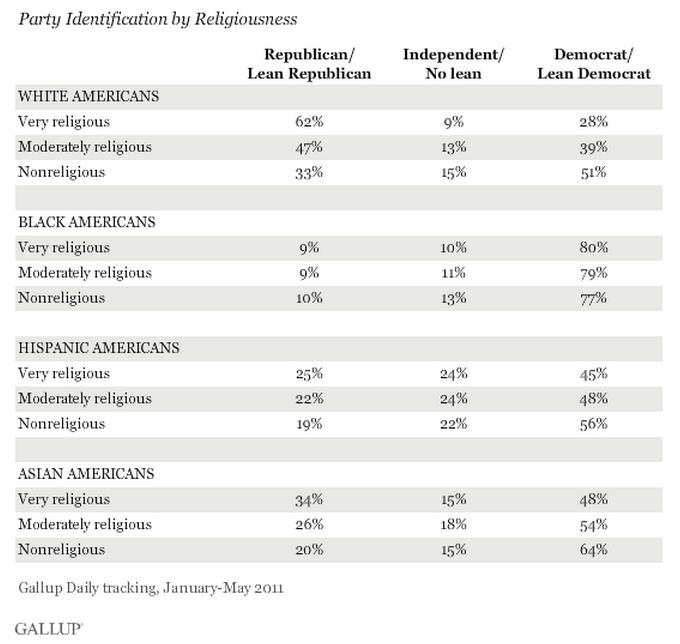
Identifying as Republican is strongly associated with religiosity in the U.S., so much so that people often use the term “Republican” and “Religious Right” interchangeably. Indeed, religious people are more likely to be politically conservative overall, but a Gallup poll shows that this relationship is moderated by race.  The figure below cross-tabulates religiosity for four racial/ethnic groups with the likelihood of affiliating with the Democratic or Republican party or neither.  You can see that the typical relationship — religion/Republican and no religion/Democrat — holds for all groups, except for African Americans.

At Gallup, Frank Newport writes:

Asian and Hispanic Americans, regardless of religiousness, are more likely to identify as Democrats than Republicans. But the Democratic advantage goes from 14 points among very religious Asians to 44 points among nonreligious Asians. The differences are less substantial among Hispanics; very religious Hispanics are more likely to identify themselves as a Democrats than Republicans by 20 points, while nonreligious Hispanics are more likely to identify themselves as Democrats by a larger 36-point margin.

Personal religiousness makes little difference among blacks, however, as the powerful partisan pull of Democratic identification among black Americans trumps any influence of religion.

The report is a great example of the importance of doing intersectional analyses.  When you pull groups apart (by, say, adding race when looking at the relationship between religion and politics), you often find that a more generalized examination is hiding interesting details.

Lisa Wade, PhD is an Associate Professor at Tulane University. She is the author of American Hookup, a book about college sexual culture; a textbook about gender; and a forthcoming introductory text: Terrible Magnificent Sociology. You can follow her on Twitter and Instagram.

Last week Gwenyth Paltrow tweeteda photograph of Kanye West and Jay-Z performing in France along with the text: “Ni**as in paris for real.”  The tweet started a conversation about her right to use the n-word, even with asterisks. Paltrow defended herself, claiming that it is the name of the song they were performing (which it is).

At Colorlines, Jay Smooth offers a characteristically entertaining and insightful analysis of the incident.  What’s interesting, he observes, isn’t so much her use of the word, but her defensiveness about it.  Here’s how he puts it:

No matter how justified you feel, as soon as you start arguing about your right to use the n–, that is a sign that you have become too attached to the n–.

He calls on her to apologize and move on with her life because…

The right to use that word is not a right worth fighting for.

A great watch:

Lisa Wade, PhD is an Associate Professor at Tulane University. She is the author of American Hookup, a book about college sexual culture; a textbook about gender; and a forthcoming introductory text: Terrible Magnificent Sociology. You can follow her on Twitter and Instagram.

The Economic Policy Institute recently released a report looking at the impacts of the recession and its aftermath on the Asian American population. Due to the model minority stereotype, Asian Americans are often overlooked in discussions of the economic crisis or of poverty and inequality more broadly.  It is true that Asian Americans have generally had lower unemployment rates than other racial/ethnic groups, due to their overall higher educational levels. However, if we look within educational levels beyond a high school diploma, Asian Americans have higher unemployment rates than comparable Whites, with the gap widest for those with bachelor’s degrees:

The economic difficulties faced by some Asian Americans is even more noticeable when we look at long-term unemployment (joblessness that lasts 27+ weeks, or more than about half a year). The proportion of the unemployed that fall into this category has risen for every group since 2007, with African-Americans and Asian-Americans more likely than Whites or Hispanics to be unemployed for long periods:

EPI then released an update to the report, incorporating 2011 data. Long-term unemployment has inched upward for every group; half of unemployed African- and Asian-Americans have now been out of work for at least 27 weeks:

And in fact, despite their higher overall levels of education, Asian Americans now have a higher unemployment rate than Whites (though the rate for both groups is down from the peak in 2010):

For a discussion of factors that may contribute to these patterns among Asian Americans, such as their concentration in states particularly hard-hit by the recession and the proportion of the population that is foreign-born, see the full report.

Cross-posted at Montclair SocioBlog.

In recent Democratic primaries in Appalachian states, Obama lost 40% of the vote.  The anti-Obama Democrats voted for candidates like “uncommitted” (Kentucky), an unknown lawyer (Arkansas), and a man who is incarcerated in Texas (West Virginia).

Could it be that there’s racism at work in Appalachia?  Or is the anti-Obama vote based entirely on opposition to his policies?

The 2008 Presidential election — Obama v. McCain — offers some hints.  For those with short memories, the Bush legacy — an unpopular war and an economic catastrophe — may have hurt the GOP.  In that election, the country went Democratic.  The Democrats did better than they had in 2004, the Republicans worse.  But not everywhere.  The Times provides this map:

Still, it’s possible that those voters in Appalachia preferred the policies of candidate Kerry to those of candidate Obama.  As Chris Cilizza says in in a Washington Post blog (here), the idea that race had anything to do with this shift is…

…almost entirely unprovable because it relies on assuming knowledge about voter motivations that — without being a mindreader — no one can know.

Cilizza quotes Cornell Belcher, the head of a polling firm with the Monkish name Brilliant Corners:

One man’s racial differences is another man’s cultural differences.

Right.  The folks in Appalachia preferred John Kerry’s culture.

I’m generally cautious about attributing mental characteristics to people based on a single bit of behavior.  But David Weigel, in Slate, goes back to the 2008 Democratic primaries – Obama versus Hillary Clinton.  A CNN exit poll asked voters if race was an important factor in their vote. In West Virginia and Kentucky, about 20% of the voters in the Democratic primary said yes.  Were those admittedly race-conscious voters more anti-Obama than other Democrats?

As Weigel points out, this was before Obama took office, before voters really knew what policies he would propose.  Besides, there wasn’t all that much difference in his policies and those of Hillary Clinton.

Cilizza is right that we can’t read voters’ minds.  But to argue that there was no racial motivation, you have to discount what the voters said and what they did.

Last week, the Census Bureau announced that as of July 1, 2011, for the first time the majority (50.4%) of babies under age 1 in the U.S. were not non-Hispanic Whites. Animal New York posted a video by Jay Smooth discussing the reactions to and implications of this news:

You can see the NYT article Jay Smooth parodies here, but note that the graph is mislabeled. The line labeled “White” actually only represents the data for non-Hispanic Whites, while the line labeled “Non-White” includes births to White Hispanics, so the terminology they used doesn’t accurately reflect what the graph illustrates.

We’ve posted a number of times on the use of non-Western locations, and their residents, as background props in ads, catalogs, and fashion spreads, and the examples keep coming. A while back, Rebecca Smith-Mandin sent in this ad for Conrad hotels, in which the implicitly wealthy, White audience is invited to indulge in “the luxury of being yourself,” which includes the ability to have authentic, off-the-beaten-path experiences in far-flung locales, while remaining clearly distinct from them:

Similarly, last year Anna-Sara H. found this image in the German women’s magazine Freundin:

Anna-Sarah’s translation (which she says loses some of the poetic intent of the original):

We are playing mermaid. And wrap ourselves in light-bright outfits now, adorned with large-sized ethnic accessories. The only things missing are an innocent gaze and hair being played with by the wind.

In both cases, we see a very common trend in ads or photo shoots for fashion and luxury services: non-White individuals may be included in the photo shoot, but they are not used to model the use of the product or service itself. As Ashley Mears argues in her ethnography of modeling, Pricing Beauty: The Making of a Fashion Model, non-White bodies are generally seen as incompatible with the idealized fantasy of inaccessibility and sophistication that is the guiding aesthetic for fashion mag editorials and advertisements for luxury goods. In these images, we see that non-Whites are included in a way that superficially increases diversity in a magazine’s pages, without disrupting the assumption that the imagined consumer — the subject of these images — is White.

Erin Hatton sent in a 1937 redlining map of Philadelphia, so I decided to update our earlier post on segregation and redlining in the city.

—————

One historical cause of residential segregation was redlining. Lenders would color-code different neighborhoods on residential maps; red was generally the color used to designate a neighborhood as “dangerous,” meaning mortgages would not be approved in those areas, since they were considered to be high-risk areas for mortgage defaults. This was generally a blanket rule: people found themselves unable to get mortgages to buy property in redlined areas, regardless of their income or the value of the particular house they wanted to buy. And a high proportion of Black (and sometimes White immigrant) residents generally meant that a neighborhood would be automatically tagged as a high-risk area.

The University of Pennsylvania Redlining in Philadelphia project provides an example of a map created to guide lending in Philadelphia. The map was created in 1934 by J.M. Brewer, who owned a real estate consulting company and later was chief appraiser for Metropolitan Life Insurance.

This legend was adapted from the original for the U. of Pennsylvania website:

The legend looks like the “colored” areas are coded yellow, but it’s actually red on the map. Brewer created another map in 1935 and helped draw the federal Home Owners’ Loan Corporation (HOLC) map of Philadelphia in 1937.

Erin Hatton sent a link to that 1937 HOLC map, which reflects the governmental institutionalization of racism, marking some groups as inherently undesirable:

If you go to Redlining Philadelphia and click on areas of the map, it links to the survey sheets used to rate each neighborhood. All include a section on detrimental elements and a demographics breakdown, with areas to note the presence of immigrants, African Americans, poor families, and so on, such as this section of a survey sheet for area 22, giving a security grade of D:

African Americans were not the only group targeted by redlining. For instance, the survey sheet for area 5 mentions the “danger of Jewish encroachment”:

Redlining made it difficult for Blacks (and some White ethnics) to buy homes. Racial discrimination meant Blacks often couldn’t buy homes outside Black neighborhoods, but Black neighborhoods were often redlined by lenders, meaning Blacks couldn’t get mortgages to buy houses inside them, either. As a result, African Americans were disproportionately barred from one of the major avenues to acquiring wealth (building equity through home ownership), leading to increasing racial disparities in wealth and home ownership over time.

Also check out our post on segregated Durham.

Anderson Cooper 360 posted a video based on a study they sponsored of kids’ perceptions of race and friendships. The results are not surprising: kids pick up on larger social patterns, such as the fact that the adults around them often have few significant friendships across racial lines, and struggle to make sense of what they see. By age 6 they are highly aware of race and have formed clear ideas about how adults feel about people of other races than their own. Moreover, they’ve internalized cultural messages about race. As the clip shows, the race of the children themselves, as well as the race of children in images they are shown, impacts how they interpret the events in the pictures, with White children attributing more negative behaviors to African Americans in the photos:

Also check out Anderson Cooper’s earlier segments on children’s attitudes about skin color.