organizations/institutions

Cross-posted at Cyborgology.

Humans produce waste. A lot of waste—much of which comes from our very bodies. Indeed, the average American produces 7 pounds of organic waste per day, largely made up of feces and urine. Cities have to somehow manage this waste, manage these now expelled parts of human bodies, manage that which we produce, drop, leave, and conscientiously ignore. Such management is typically engaged by an underclass of workers, the sanitation department, waste management employees, septic cleaners. When all goes well, waste remains invisible. Unsmelled. Unseen. Silently moved through underground systems and channeled out in ambiguous ways. This is a process to which most producers of bodily waste remain blissfully ignorant.

Sometimes, however, this waste management becomes a problem, and when it does, our expelled and forgotten matter spills back up into human view, reconnecting humans with the ways in which their own bodies must be managed through external structures; reminding humans of the dirty reality of organic embodiment. Such is the case in the New York City sewer system. High water levels, coupled with high waste levels, can lead to sewer overflows, flushing raw human waste into the city’s waterways — including the East River and the Hudson. Nothing reminds humans of their own embodiment like literal consumption of expelled matter. Nothing reconnects humans to an otherwise hidden process than their own shit floating down the river.

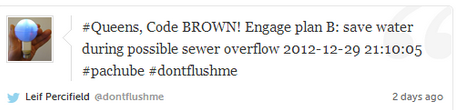
A recent solution to this problem of waste re-emergence comes from an unlikely place: social media. Leif Percifield recently introduced a social media tool called DontFlushMe, which allows New Yorkers to keep track of water levels and make waste management decisions accordingly — that is, decisions about whether or not to flush. The system works through sensors within the sewers, which notify users of high water levels via text message, Twitter, a call-in number, or by a website. When water levels get too high, users will ostensibly “let it mellow,” reducing the influx of waste into the sewer systems, and preserving the waterways.

The role of social media here is particularly interesting. Here we have a social tool, a communication medium necessarily removed from the body and physicality, working to reconnect the user to hir body, and reconnect the body to the architectures and structures in which it dwells. This form of mediated communication thins the mediating line between personal actions and public good, between expelling and consuming, between individuals and infrastructures. This tool makes invisible processes visible, and turns everyone into stewards of the shared land.

Such reconnection — between humans and their bodies; between individuals and infrastructures — is facilitated by a tool so often accused of causing disembodiment and disconnection. Social media republicizes and disseminates responsibility for that which was previously relegated out of sight, smell, and mind. This “new” technology, ironically, brings us back to an earlier time of chamber pots and smelly streets, in which bodily awareness was a communal necessity.

*Special thanks to James Chouinard for bringing this social media tool to my attention, and for sharing his vast knowledge on the Sociology of Dirt.

 ————————-

Jenny Davis is a postdoctoral researcher in the social psychology lab at Texas A&M University. Follow Jenny on twitter @Jup83.

Cross-posted at Racialicious.
Sociologist Jooyoung Lee is writing what sounds like a truly fascinating book. Titled Blowing Up: Rap Dreams in LA, it follows a series of young Black men who are trying to make it as rappers.  “Together,” Lee writes, “their stories show how rapping — and Hip Hop culture more generally — transform the social worlds of urban poor black youths.”

The video below gives us a taste of his findings.  In it, he’s asked why he thinks rappers are “so maligned in our culture.”  He explains that it’s because people often “take violent and misogynistic lyrics” literally.  Doing so, however, is to misunderstand “how the creative process works.”  He goes on to explain how one of the men he studied was pressured by a music label to cultivate an image that conformed to stereotypes of young, urban Black men.

Lisa Wade, PhD is an Associate Professor at Tulane University. She is the author of American Hookup, a book about college sexual culture; a textbook about gender; and a forthcoming introductory text: Terrible Magnificent Sociology. You can follow her on Twitter and Instagram.

Two days after 6 adults and 20 elementary school children were shot and killed in Newtown, CT, the Miami Herald homepage looked like this:

On the left side of this screenshot, the Herald shows images of the dead and notes how “America mourns” their loss. At right, one of their five-or-so rotating advertisements shows a large handgun and links to a website for the U.S. Concealed Carry Association, a company that sells – among other things – strategies to quickly arrange for conceal carry permits in your state.

The company’s tagline: “Knowledge is your best weapon. Preparation is your best defense.” Apparently, to a segment of the population this visual coupling advertisement read something like, “Mourn for now. Lock and load for next time.”

That such a provocative advertisement would appear in close proximity to a sensitive news story is unlikely to be accidental. News outlets are quite smart about what they post – and where – both in terms of news products and paid content.

But this juxtaposition of weaponry and those who have died from such products represents more than a short-term economic choice. Instead, it reflects the fact that we live in a culture that strongly supports gun ownership and loose gun control laws.  Had the newspaper thought that such an advertisement — published at this particular time and in this particular way — would ostracize their audience or advertisers, they wouldn’t have run it.

Some call the media the “fourth estate” – an institution that, alongside the courts, the oval office, and congress, keeps our country in balance. The juxtaposition in that screenshot, however, calls into question this role for the traditional media. Instead, they are simply reflecting the status quo, one largely controlled by those who are already in power. If this is the case, we can’t count on the media to check the power elite.  Any real change, then, is going to come from collective action and alternative media.

—————————

Robert Gutsche Jr. is an assistant professor in the School of Journalism and Mass Communication at Florida International University. His research deals with the sociology of news and news as a cultural artifact.

Cross-posted at The Huffington Post.In most densely-packed urban cities, one will be able to observe a disturbing phenomenon: wealthy people marching past the homeless, day in and day out.  Often, the residents of the street and the residents of the apartments recognize each other and even know each other’s routines.  And, yet, familiarity doesn’t breed concern.

Psychologists Lasana Harris and Susan Fiske were able to detect a neurological process behind the ability to get used to seeing others suffer. Using functional MRIs, they exposed individuals to images of the homeless.  These images tended to activate parts of the brain associated with disgust.  This, they argue, supports the idea that “extreme out-groups may be perceived as less than human…”  It is easy to overlook the suffering of the homeless, then, because we dehumanize them.

In an effort to disrupt this cognitive process, documentary film maker Goro Toshima has released a new film, Broken Doors.  The 36-minute documentary follows a young homeless couple in Los Angeles, Starr and Rico.  Not only does it put faces and names to an otherwise reviled and ignored population, the documentary shows viewers just how difficult it can be to survive on the streets and to get off.

Lisa Wade, PhD is an Associate Professor at Tulane University. She is the author of American Hookup, a book about college sexual culture; a textbook about gender; and a forthcoming introductory text: Terrible Magnificent Sociology. You can follow her on Twitter and Instagram.

Cross-posted at Montclair SocioBlog.

In a democracy, all votes are created equal — one person, one vote -– but apparently some votes are more equal than others.  Obama won the electoral college vote 62% – 38%, though his margin in the popular vote was much smaller: 51% – 48%.

A similar discrepancy happened in the vote for Congressional representatives.  The Republicans control the House of Representatives, where they have 54% of the seats. But if you add up all the votes for those seats, the Democrats come out slightly ahead (by about 500,000 votes).  More votes but fewer seats.

That discrepancy arises from the distribution of Democrats and Republicans in a state’s Congressional districts.  Take a hypothetical state with four districts, each with 200 people.  The popular vote splits evenly –- 400 Democrats, 400 Republicans. Here are the election results:

The Republicans have 50% of the popular vote but get 75% of the seats.
Less hypothetically, in North Carolina, Democratic candidates outpolled Republicans 2.22 million to 2.14 million.  But Republicans won 10 of the 14 seats.  The Democratic votes were crowded into four districts.  In three of those four districts, the Democrats won big – by an average of 133,000 votes.  (If the 7th district, where Democrats now have a slim lead, goes Republican, that average margin will be 177,000.)  Had some of the Democrats from one of those districts been mapped into the neighboring district, they might have won both, though by smaller margins.  The Republican districts had secure but smaller majorities.  Republican winning margins averaged 50,000 votes, less than half the margin where Democrats won.

My first thought was that this was pure Gerrymandering.  State legislatures get to draw the maps of their Congressional districts.  And many more state legislatures are controlled by Republicans.  In fact, some of the North Carolina districts have unusual shapes.  The NC-12, the thin blue line along Interstate 85 stretching nearly to the border, was created as a “majority-minority” district so that Black votes would not be diluted.  The downside for Democrats is that it packs those votes into that narrow corridor.  So the Democrats take that district by over 180,000 votes.  The Republicans with the neighboring districts but by much smaller margins – 23,000, 25,000, and 53,000.  In those four districts, the Democrats got 53% of the vote, but Republicans took three of the four seats.

The Democratic district snaking down through the middle of the state is the 4th, which contains “the Triangle” to the north, but now has that tail stretching down.  Democrats carried the district  by 170,000 votes.  Surrounding it is the 2nd (in pink), which Republicans carried by only 45,000 votes.

Similar differences crop up in Ohio and Pennsylvania. The popular vote is close, and in two of these states it goes to the Democrats.  But Republicans get most of the seats.  Republicans win their seats by less than half the margin of Democratic winners.  Here is a graph of the actual returns from Ohio, Pennsylvania, and North Carolina. (The Ohio total does not include the vote from the two uncontested districts, one Democrat, one Republican.  For the maps and election results, check out Politico.)

The Republican share of Congressional seats is far out of proportion to its share of the vote.  In Ohio and North Carolina, Democrats received more votes, but Republicans got 70-75% of the House seats.  It certainly is possible that Republican-dominated state legislatures drew the districts so as to cram Democratic voters into electoral ghettos.

I don’t know enough about the demography and geography of these states, but I do wonder why the districts are drawn this way.  A paper by Chen and Rodd (here) that uses 2000 election data argues that what looks like gerrymandering is in fact the result of “human geography.”  It’s not the legislatures that pack Democrats together, it’s the Democrats themselves.  They cluster in cities.  As for Democrats outside of cities,

many rural, small-town, and suburban precincts that lean Democratic are often subsumed into moderately Republican districts. . . . There are isolated pockets of support for Democrats in African-American enclaves in the suburbs of big cities and in smaller towns with a history of railroad industrialization or universities. However, these Democratic pockets are generally surrounded by Republican majorities, thus wasting these Democratic votes. As a result, the Democrats are poorly situated to win districts outside of the urban core.

Regardless of intent, the effect is to keep Democratic votes concentrated in the 4th.  If that blue tail of the NC-04 were subsumed into the pink NC-02, both districts might be blue.

In any case, Democrats have not always been on the wrong side of the seat/vote discrepancy.  John Sides at The Monkey Cage posted this graph showing the ratio for the last twenty-six elections.

Sides quotes Matthew Green on the general trends:

  • the winning party usually gets a “boost” in the number of seats
  • that boost used to be much larger

That trend might fit with the deliberate-gerrymander explanation, provided that in the earlier decades more state legislatures were controlled by Democrats.  But I’m not sure how it fits with Chen and Rodden’s human geography idea of “unintentional gerrymandering.”

—————————

Jay Livingston is the chair of the Sociology Department at Montclair State University.  You can follow him at Montclair SocioBlog or on Twitter.

Jay Livingston is the chair of the Sociology Department at Montclair State University. You can follow him at Montclair SocioBlog or on Twitter.

While the news often discusses the proportion of the population that is unemployed, sociologists also talk about the working poor (people with full time jobs, but who are paid so little that they remain below the poverty line) and the underemployed (e.g., people who have part-time jobs, but wish they were full-time).

The New York Times recently put together a graphic illustrating the rise of underemployment due to the recession. Overall, the number of people who are working part-time involuntarily has risen.  In the related article, reporter Steven Greenhouse quotes a retail consultant explaining: “Over the past two decades, many major retailers went from a quotient of 70 to 80 percent full-time to at least 70 percent part-time across the industry.”  Underemployment has risen in some economic sectors more than others, notably leisure/hospitality and wholesale/retail:

Among other employers, Greenhouse profiles a Fresh & Easy store in San Diego. Employed there are 5 full-time managers and 17 part-time workers.  Shannon Hardin, who has worked there for five years, averages 28 hours a week and earns $10.90 an hour.

Workers like Hardin often get very short shifts (designed to increase the number of employees in the store only during rush times), irregular schedules (making it difficult to arrange childcare), and last minute requests to work.  Being inflexible can get an employee fired.

This is why employers like part-timers; from the company’s perspective, they’re cheap and flexible:

From the employee’s perspective, of course, it means a meager existence, an uncertain future, and a life led at the whims of a company’s bottom line.

Lisa Wade, PhD is an Associate Professor at Tulane University. She is the author of American Hookup, a book about college sexual culture; a textbook about gender; and a forthcoming introductory text: Terrible Magnificent Sociology. You can follow her on Twitter and Instagram.

Cross-posted at Montclair SocioBlog.

Back in June, Mitt Romney said:

I want to make sure that we keep America a place of opportunity, where everyone… get[s] as much education as they can afford

After all, Mitt got as much education as he (his parents, really) could afford, so he thought it best if everyone had that same opportunity.

Opportunity – How much is that in American money?

Yesterday, Planet Money  posted this graph showing the costs and benefits of a college education in several countries.

The title of the post summarizes the interpretation of the college-educated folks at Planet Money:

“College Costs More In America, But The Payoff Is Bigger”

But what if you look at the data from the other side?  Here’s the half-empty-glass title:

“College in the US Costs a Lot, and If You Can’t Afford It, You’re Really Screwed”

…or words to that effect.

What the chart seems to show is inequality — specifically, the inequality between the college educated and everyone else.  In advanced economies, like the those of the countries in the chart, education is important. But some of those countries, like the Scandinavian countries, have reduced the income sacrificed by non-college people relative to the college educated. Other countries favor a more unequal distribution of income.

To look a little closer, I looked at the relationship between the payoff of a BA degree for men and a country’s Gini coefficient, a measure of inequality.  I used the ten countries in the Planet Money chart and added another ten OECD countries.

The correlation is 0.44.  The US is the clear outlier.  In the land of opportunity, if you’re a male, either you pay the considerable price of going to college, or you pay the price for not going to college.

With this inequality come the kinds of social consequences that Charles Murray elaborates in his latest book about non-educated Whites — disability, divorce, demoralization, death.

—————————

Jay Livingston is the chair of the Sociology Department at Montclair State University.  You can follow him at Montclair SocioBlog or on Twitter.

Well, first, they’re not baby carrots.  The two-inch carrots marketed as juveniles are actually pieces of regular sized carrots that are cut off and shaved into a “baby carrot” shape.  So, there’s no reason to expect the babies to be fresher, more tender, or sweeter. (Sorry, baby carrot lovers.)

But revealing how baby carrots are made is only Part I of the answer to the question of where they come from.  Who had the idea to make “baby carrots” and for what reason?

It turns out the idea came from a grower named Mike Yurosek.  According to Douglas McGray at Fast Company, it was grocery stores that pushed Yurosek to invent the baby carrot.  McGray writes:

…Yurosek had become frustrated with all the waste in the carrot business. Supermarkets expected carrots to be a particular size, shape, and color. Anything else had to be sold for juice or processing or animal feed, or just thrown away. Yurosek wondered what would happen if he peeled the skin off the gnarly carrots, cut them into pieces, and sold them in bags.

He whipped up two prototypes: the baby carrot with which we’re all familiar and “bunny balls,” 1-inch round carrot bites.  Somehow the latter didn’t catch on.  The rest is history.

Thanks to Annie C. for sending in the link!

Lisa Wade, PhD is an Associate Professor at Tulane University. She is the author of American Hookup, a book about college sexual culture; a textbook about gender; and a forthcoming introductory text: Terrible Magnificent Sociology. You can follow her on Twitter and Instagram.